
Which is better – a parliamentary or presidential republic
The article analyzes the relationship between forms of government and democracy from 2006 to 2022 on a sample of 153 countries. Additionally, the impact of forms of government on economic well-being is examined. The results confirm the superiority of parliamentarism in terms of the level of democracy and also indicate a higher GDP per capita compared to presidential and hybrid republics.
In political and public discussions, the advantages of parliamentarism compared to presidential republics have been discussed previously12 (if the differences between these systems are unclear to you, we refer you to our article on political systems). It is argued that a parliament better reflects the opinion of the majority of the population, is more decentralized by nature, due to which power is not concentrated in the hands of a small group of people or a single individual, and constant discussions and search for compromises allow ideas to circulate and produce more optimal decisions, which ultimately can be reflected in a higher level of public well-being. Nevertheless, having a parliamentary form of government does not always guarantee that a country will be a stable democracy. Parliamentarism failed to protect Turkey from its recent transition to an authoritarian regime, and Hungary and Serbia — parliamentary republics — are currently among the least democratic countries in Europe.
Frequently discussed empirical data in support of parliamentarism cover a small number of countries (usually a few dozen of the most democratic and economically successful) and do not account for the influence of third factors. First and foremost, this concerns the level of economic development, which is also closely linked to democracy3: it is entirely possible that the difference in the level of democracy between countries is driven by differences in economic well-being, which may also be historically conditioned, and a significant portion of parliamentary democracies is represented by countries that have high per capita income. In addition, there are successful democratic presidential republics, such as the US or South Korea, as well as generally authoritarian and poor parliamentary countries, such as Iraq or Pakistan.
To expand the empirical material on the issue of the success of parliamentarism from the perspective of democracy, while taking economic development into account, a corresponding study is conducted, consisting of two stages:
- Measuring the relationship between forms of government and the level of democracy across the full available sample, which includes 153 countries;
- And measuring this same relationship among countries considered democratic, which includes a subsample of 60 states.
Using a simple REWB model, it was established that parliamentary democracies in both cases have a statistically significant advantage over presidential republics in the level of democracy measured via The Economist’s Democracy Index. Additionally, it was also confirmed that parliamentary states in general have a higher GDP per capita, although this is less significant in the subsample of democratic countries.
Data and methodology
To conduct the study, The Economist’s Democracy Index4 was collected for all available years, as it allows assessing the level of democracy with a single value, World Bank data on GDP per capita both in current US dollars5 and in purchasing power parity6, as well as data on population size7 and land area of countries8, which will serve as covariates (that is, variables that may interfere and are therefore controlled for in the study). An important step is the classification of countries by forms of government, and several sources providing such information were examined, including CIA data9, the DPI dataset10, and an infographic list from Wikipedia11. Since the DPI data are limited to 2020 and do not separate various hybrid regimes, preference was given to data from the CIA World Factbook, as it includes more countries with fewer repetitions compared to the Wikipedia list. Nevertheless, the results for the CIA and Wikipedia data, as was later established, largely agree with each other. During manual processing, countries were assigned to one of 4 categories: parliamentary, presidential, hybrid, and others, which included absolute, semi-constitutional monarchies, single-party regimes, and theocracies. Additionally, countries were divided into 4 regime types according to the Democracy Index: full and flawed democracies, as well as hybrid and authoritarian regimes.
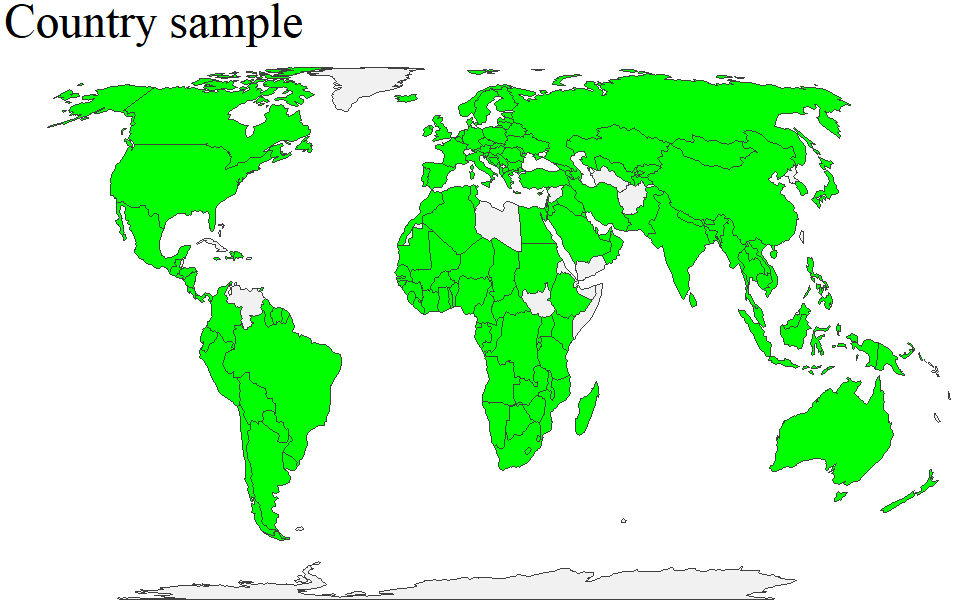
By combining all the data, removing controversial or currently legally uncertain state governments, such as Afghanistan, and removing countries with missing GDP per capita values to make the panel balanced, the sample comprised 153 states, and the period considered spans 15 years: from 2006 to 2022, with 2007 and 2009 missing. For clarity, the sample countries were marked in green on the map.
The subsample of democratic countries includes 60 states that were either full or flawed democracies throughout the entire period under consideration; countries that had any other regime even once were excluded so that only democratic states were accounted for in each year of observation. Additionally, based on GDP per capita at PPP, 4 groups of countries were formed: poor, below median, above median, and rich, corresponding to 4 quartiles.
For the analysis, all available data are preliminary visualized and smoothed using LOESS regression. Next, a Chi-square test of independence is used for categorical data for 2022, and after obtaining preliminary results, corresponding simple REWB (Random Effects Within-Between) models are constructed, as they, unlike complex ones, do not lead to convergence issues for the available dataset. The general formula for such a model is as follows12:
yit = β0 + β1W(xit − x̄i) + β2Bx̄i + β3zi + (νi + εit)
- xit − x̄i — centered predictor value
- x̄i — mean predictor value
- β1W — within-subject effect
- β2B — between-subject effect
- β3 — coefficient for time-invariant variable
- νi — random effect
- εit — residuals
This regression belongs to mixed-effects models, which allow analyzing multilevel data, including accounting for covariates that do not change over time, thereby surpassing fixed-effects models. Unlike conventional random-effects models, REWB can analyze the impact of variables within groups13. It is recommended to include both random slopes and random intercepts in the model14. In this case, the baseline model used during the study has random intercepts for countries, allowing better analysis of their individual differences, and random slopes for the time variable as in the example15, allowing better accounting for individual time trends for each country. Since the panel being analyzed is wide, time series stationarity was not considered, and a time variable was included instead. To avoid overfitting and errors, the time variable used for the random slope is centered and scaled, due to which the correlation between random effects drops well below unity. On the other hand, when using the glmmTMB estimator, which is recommended as one of the alternatives during model convergence issues16, the calculated coefficient values generally corresponded to the baseline models, although the correlation between random effects remained at the -1 level.
In total, 8 models are fitted: 4 for the entire sample and 4 similar ones for democratic countries. The first two models in each case differ only in that one uses GDP per capita at PPP, and the other uses nominal (current) dollars. The second pair of models examines the impact of forms of government on per capita income at PPP and in nominal dollars, respectively. To measure the impact of forms of government and avoid potential collinearity, the Democracy Index is excluded for the second pair of models.
To clarify whether the fitted models are the best, alternatives were created: models that do not include any random slopes. These regressions, labeled as simplified, were also used in the data analysis, and their results are presented below. Information criteria such as AIC, AICc, BIC, as well as log-likelihood demonstrate that models with a random slope for time fit the data better. All calculations and plots were made using RStudio version 4.3.1; the “nlme” library was used to calculate REWB models17.
Analysis results
In the following chart, all observations regarding each state were plotted, after which four LOESS regressions with 95% confidence intervals for the mean, corresponding to each group of countries depending on the form of government, are visualized.
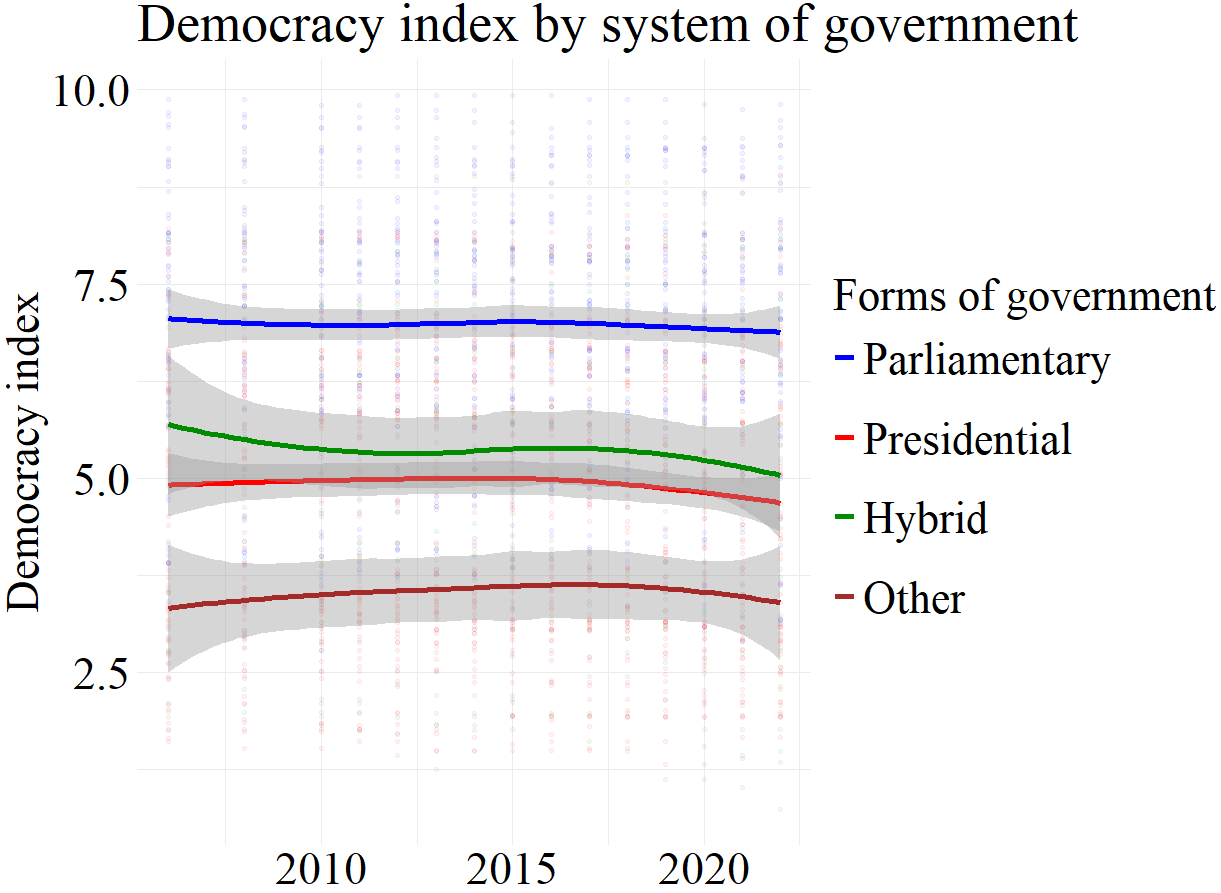
It is noticeable that parliamentary countries exceed hybrid and presidential republics by approximately 2-2.3 points on the Democracy Index.
The next two tables present the results of the Chi-square test, where the relationship between forms of government and political regime is analyzed in the first case, and the level of GDP per capita at PPP in the second, with data limited to 2022. In addition to the presented actual data, expected values for the number of countries in each category are also provided (marked with green numbers).
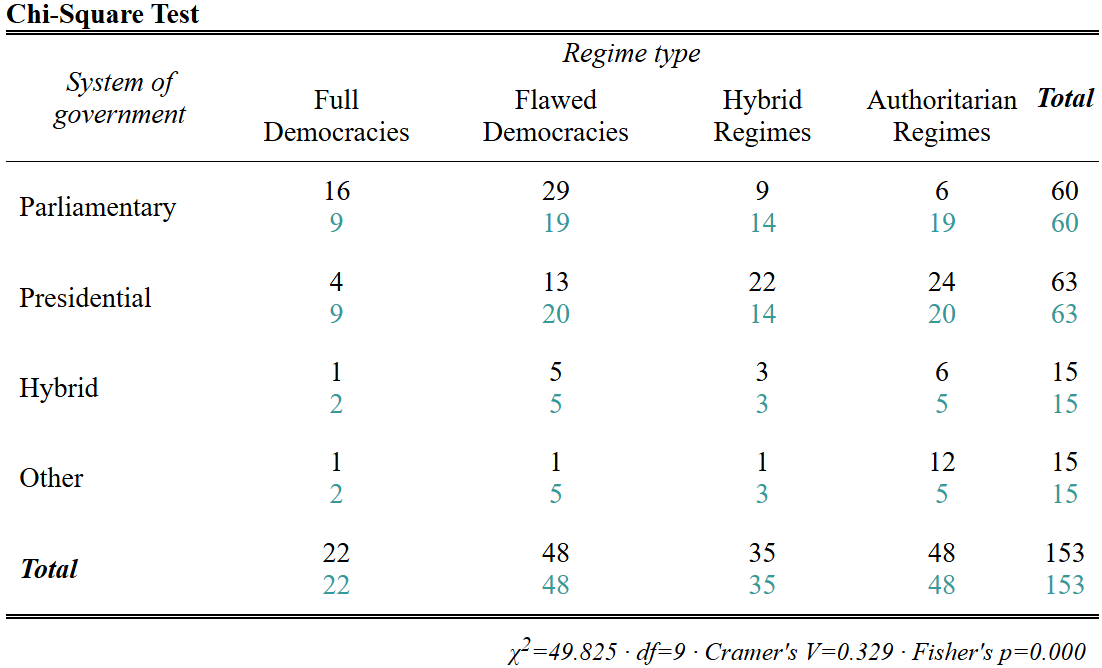
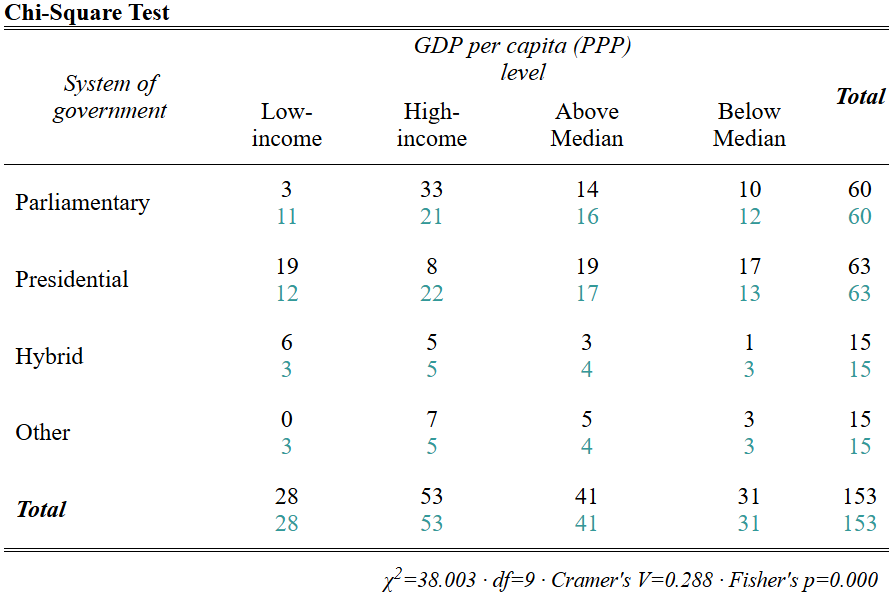
Both tests yielded statistically significant results, while it can be noted that parliamentary states are democratic and rich more often than expected. On the other hand, presidential republics are more often countries with hybrid and authoritarian regimes, and often with a low level of per capita income.
Next are the results of the first two simple REWB models. In these and subsequent models, population is measured in millions of people, GDP per capita in thousands of dollars, area in millions of square kilometers, and forms of government by default are benchmarked against parliamentary ones.
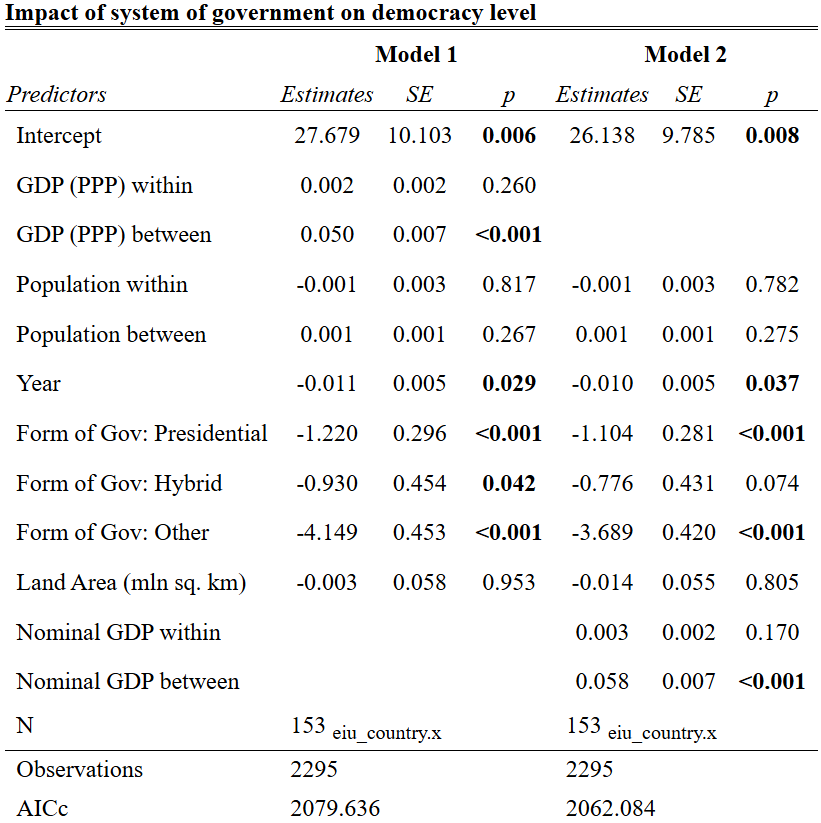
Parliamentary countries on average exceed presidential and hybrid ones by 1.1-1.2 points on the Democracy Index, which is less than the apparent difference on the LOESS regression chart. This is likely due to the fact that the level of economic development also explains a significant portion of the differences in the Democracy Index between countries, although within each country, a statistically significant effect of changes in per capita income and the level of democracy was generally not found, which may be related to the short period under consideration.
The following table reflects the difference in GDP per capita between countries with various forms of government:
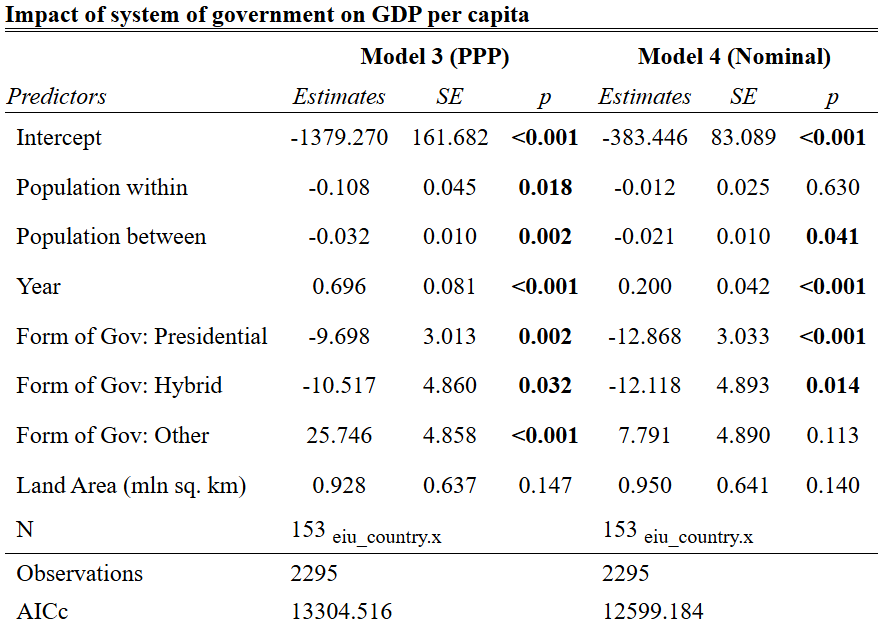
Thus, parliamentary states are on average richer than hybrid or presidential ones. The superiority of various absolute monarchies, however, can be explained primarily by their abundance of natural resources.
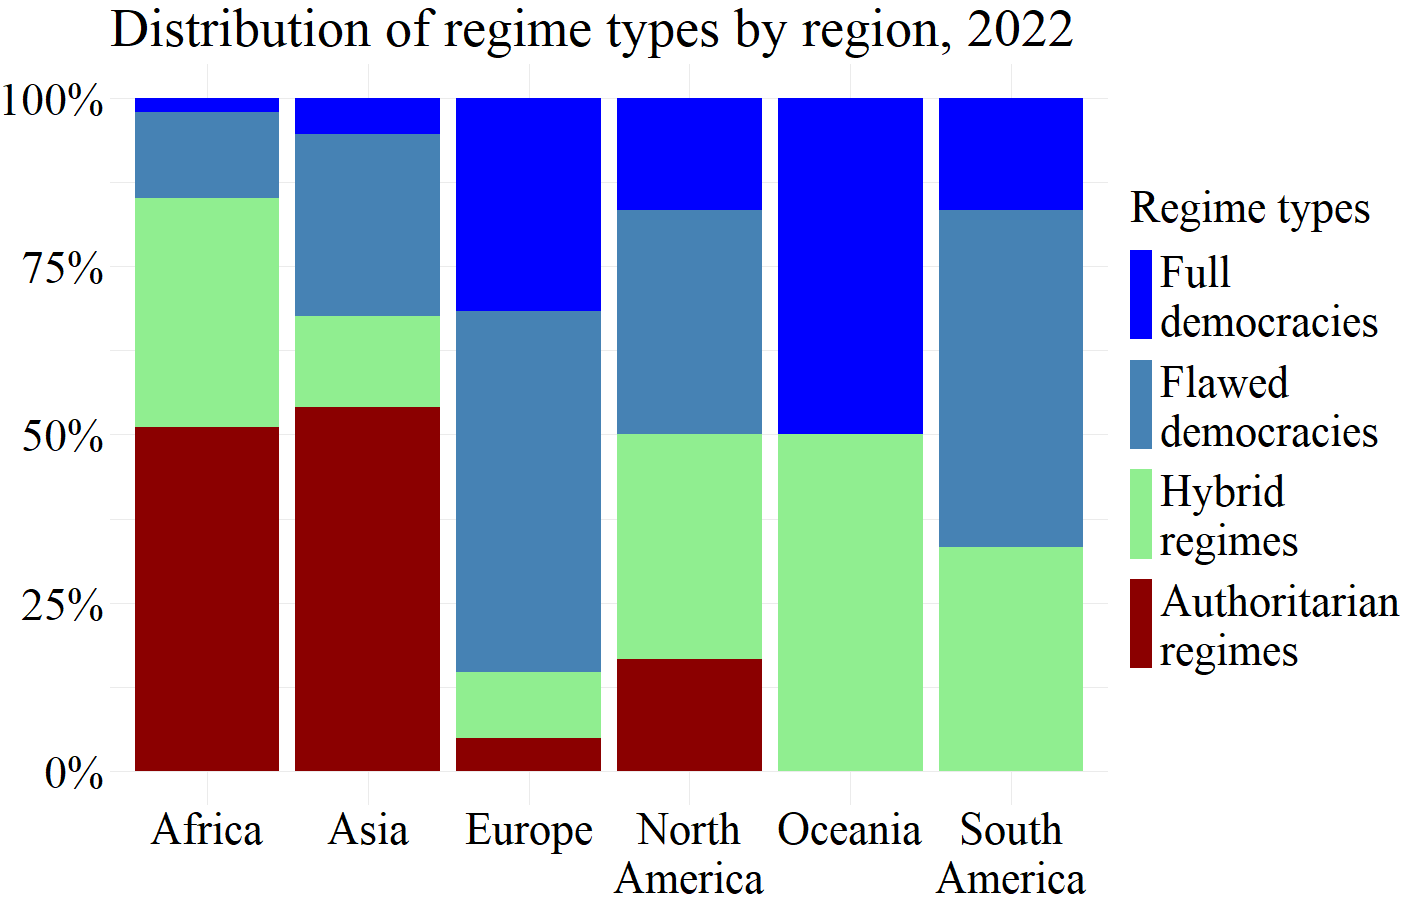
The obtained results clearly testify to the superiority of parliamentarism. Nevertheless, as shown in the following figure, most authoritarian countries are concentrated in Africa and Asia, and just as economic development increases the apparent difference in the level of democracy between parliamentary and other countries, other factors not accounted for in the model may have an additional effect.
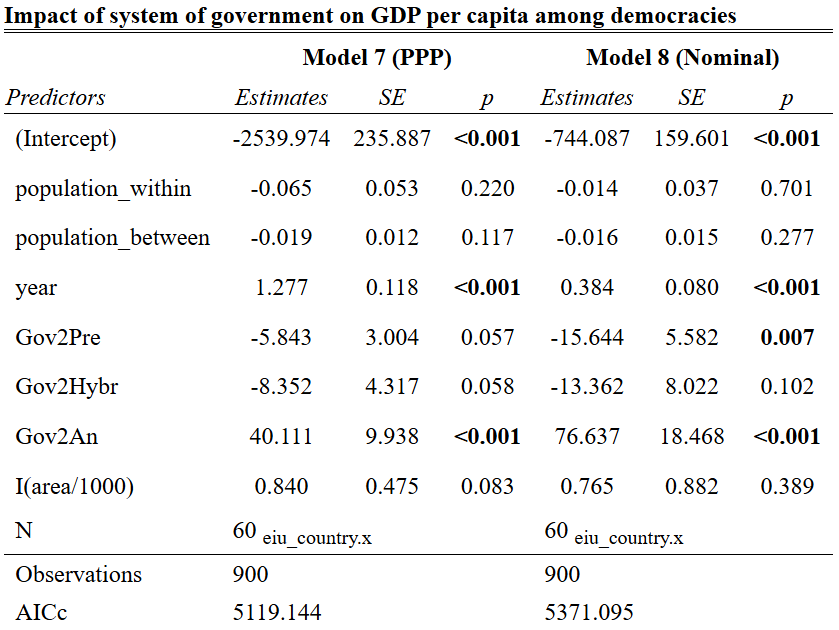
The first two REWB models for the democratic subsample also demonstrate the superiority of parliamentary democracies over presidential ones, although the difference has narrowed noticeably. It is also important to note that there is no statistically significant difference between hybrid and parliamentary democracies.
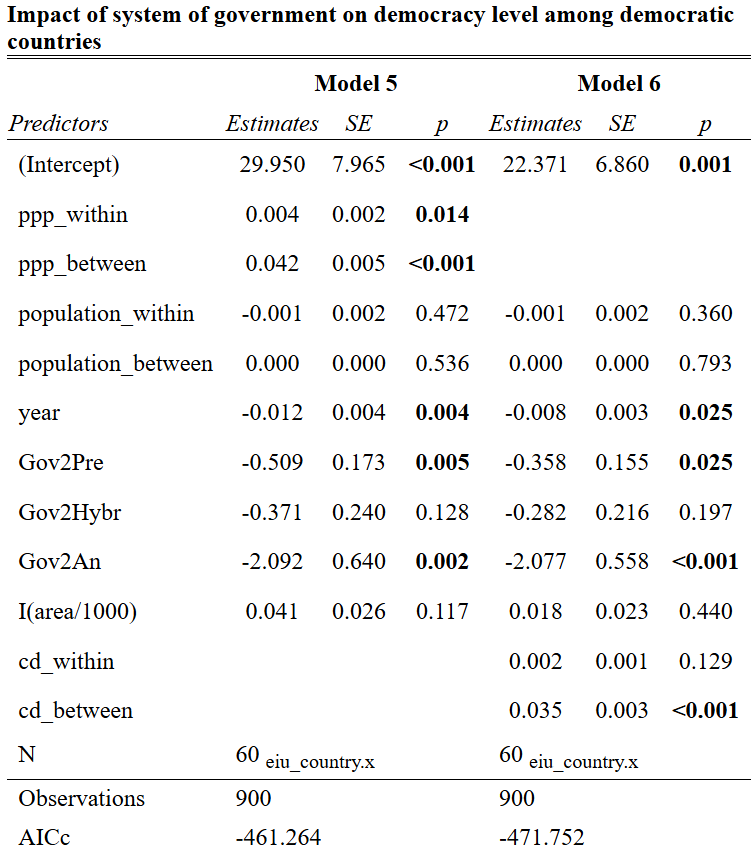
Finally, there is a small difference in GDP per capita at PPP in favor of parliamentary democracies, although it is on the verge of statistical significance for countries with presidential and hybrid forms of government. Nevertheless, nominal GDP per capita is clearly higher in parliamentary states compared to presidential ones.
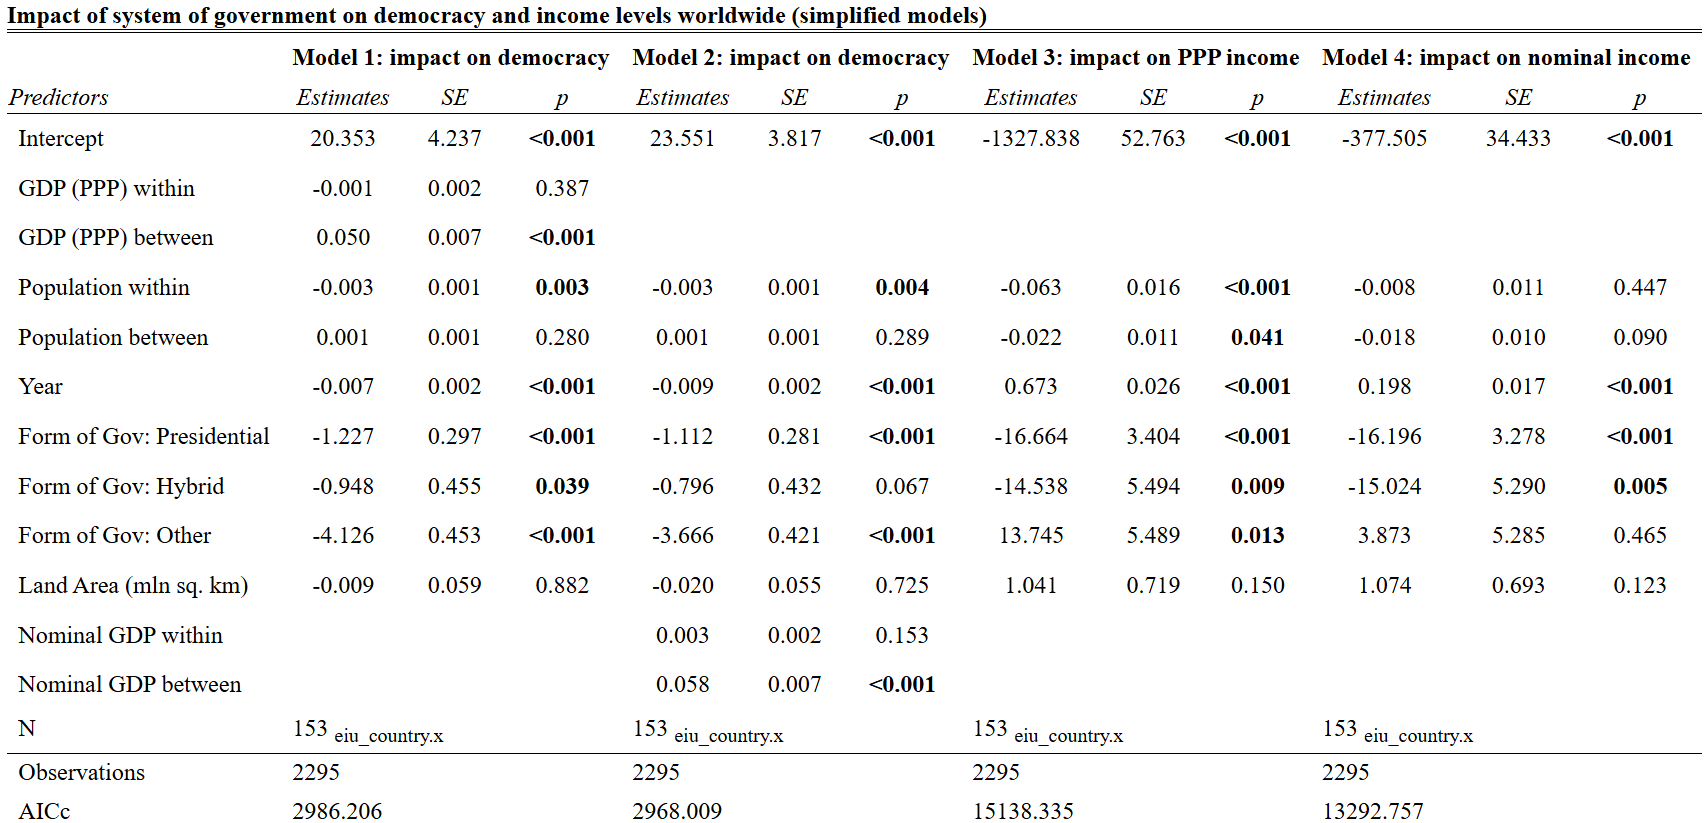
These results can be compared with the coefficient values from models without a random slope. They have the same numbering, while for the first four simplified models concerning the entire sample of 153 countries, the results are very similar to those presented earlier, confirming the advantages of parliamentarism.
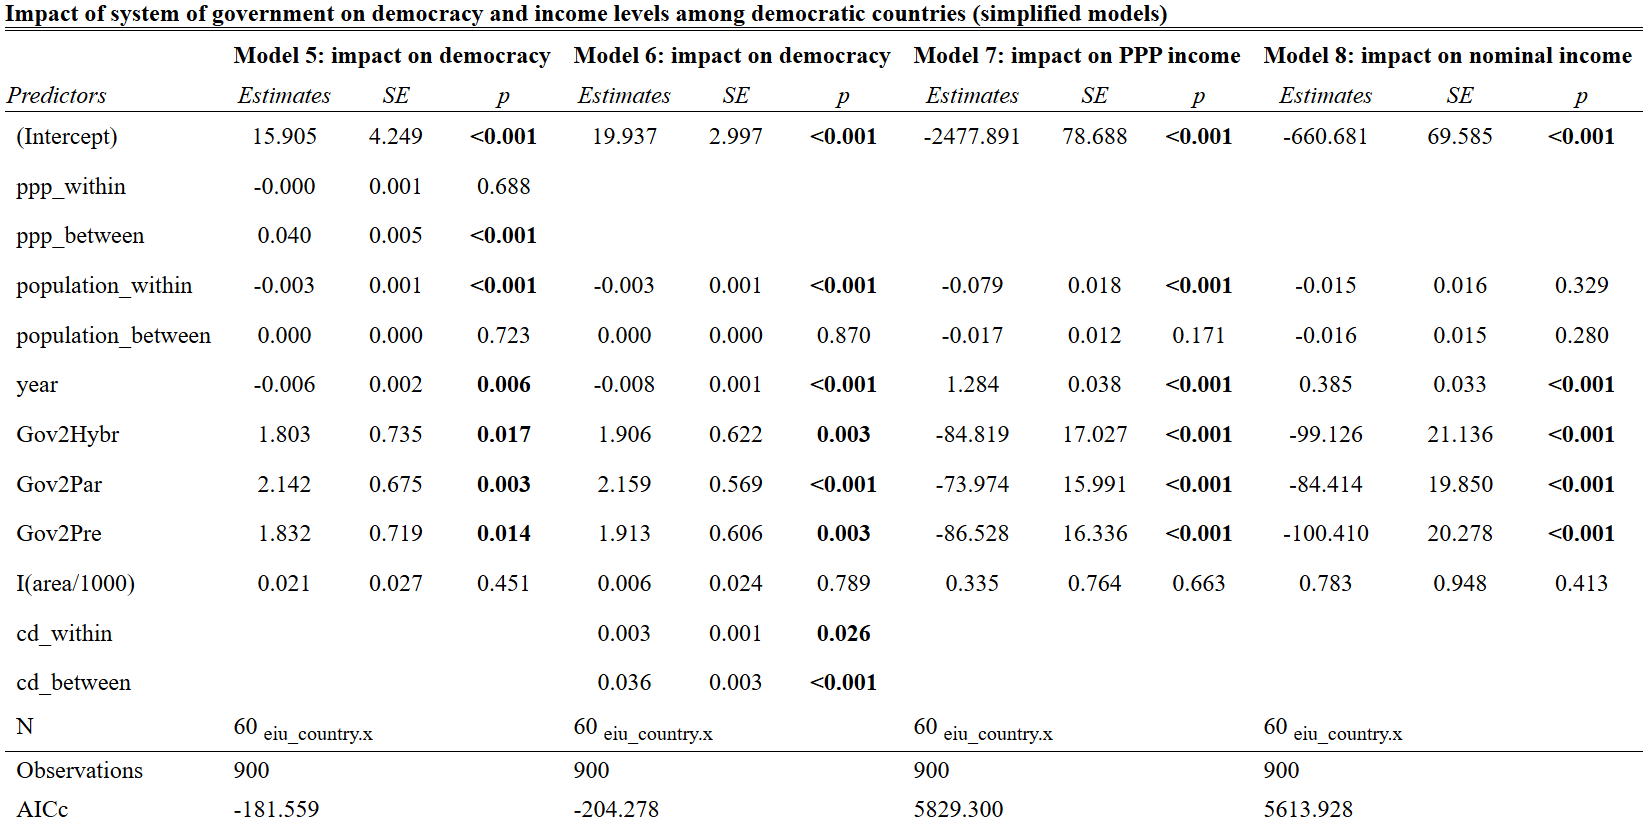
On the other hand, the simplified models failed to capture the difference in the level of democracy among the subsample of democratic countries as well. However, these models demonstrate a much larger difference in the level of economic development, clearly giving advantage to parliamentary democracies compared to presidential ones. But it should be borne in mind that simplified models have higher corrected Akaike information criterion values, indicating their lower quality.
Main findings and study limitations
Based on the results obtained, the parliamentary form of government is indeed associated with a higher level of democracy, and there are grounds to believe that parliamentarism is capable of providing better economic development for a state. It is quite possible that this is directly related to a higher level of democracy, which ensures better public well-being. But it should be taken into account that GDP per capita data are limited to a relatively short period, which was fitted to all available observation years of the Democracy Index, so conclusions regarding economic superiority should be used cautiously, preferring an alternative study if it covered a longer period.
Data on forms of government have several problems: on the one hand, different sources offer slightly different classifications of countries by forms of government, causing the number of parliamentary, presidential, and hybrid states to fluctuate greatly. On the other hand, such data practically do not account for past changes in countries’ forms of government. To guarantee the study’s conclusions, a re-analysis was conducted using information on forms of government from the Wikipedia list, and the conclusions largely match the results based on CIA data, although the economic superiority of parliamentary democracies compared to presidential ones is not as significant. However, the problem with time-invariant forms of government remains, but it can be assumed that most countries did not change it during the period under consideration.
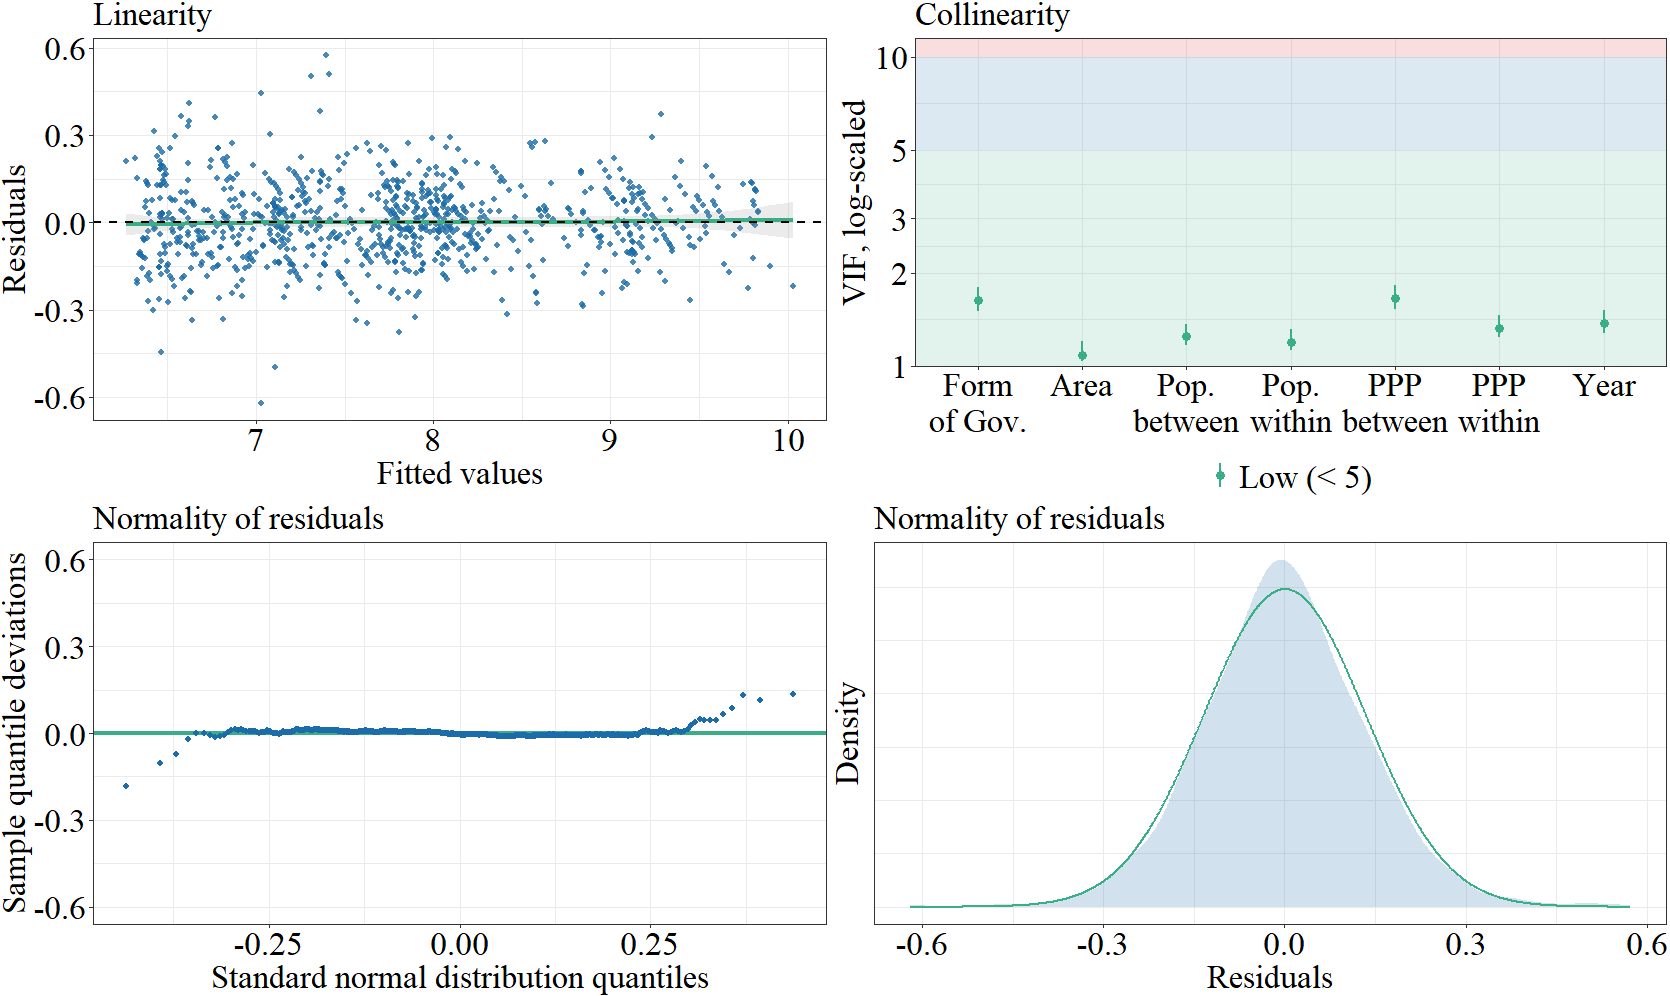
The models used were selected based on the best values of information criteria, but this does not guarantee that the model is the best possible one. Using residual diagnostics, it was established that models analyzing the effect of the form of government on GDP per capita do not capture certain patterns, causing the distribution of residuals to differ significantly from normal. But regressions examining the effect on forms of government demonstrate better results, especially Model 5, which is presented in the following charts.
For a deeper analysis, one could use the V-Dem democracy indices, which cover a longer period, and more complex methods that allow accounting for multiple random slopes or interactions between variables, as well as non-linear relationships. It is also important to use more reliable sources on state forms of government. While such alternative studies may prove preferable, in their absence, the results of this study can be used to substantiate the advantages of parliamentarism from the perspective of democracy and, to a lesser extent, economic development.
- Maxim Katz. Why a parliamentary republic is better than a presidential one. YouTube (www.youtube.com). November 21, 2020. [Electronic resource]. URL: https://youtu.be/mwa5L_9MI2E?si=glsHuqJ9xyvaa-g9 (Accessed: 29.07.2024).
- J. Linz. The Perils of Presidentialism // Journal of Democracy. 1990. Vol. 1. №1. P. 51-69.
- Pelke, L. (2023). Reanalysing the link between democracy and economic development. International Area Studies Review, 26(4), 361-383.
- Democracy index. [Electronic resource]. URL: https://ourworldindata.org/grapher/democracy-index-eiu (Accessed: 29.07.2024).
- GDP per capita (current US$). [Electronic resource]. URL: https://data.worldbank.org/indicator/NY.GDP.PCAP.CD (Accessed: 29.07.2024).
- GDP per capita, PPP (current international $). [Electronic resource]. URL: https://data.worldbank.org/indicator/NY.GDP.PCAP.PP.CD (Accessed: 29.07.2024).
- Yearly populations of countries from 1960 to 2022. Library “gt” in R. [Electronic resource]. URL: https://search.r-project.org/CRAN/refmans/gt/html/countrypops.html (Accessed: 29.07.2024).
- Land area (sq. km). [Electronic resource]. URL: https://data.worldbank.org/indicator/AG.LND.TOTL.K2 (Accessed: 29.07.2024).
- Field Listing – Government type. // The World Factbook. [Electronic resource]. URL: https://www.cia.gov/the-world-factbook/field/government-type/ (Accessed: 29.07.2024).
- The Database of Political Institutions 2020 (DPI2020). [Electronic resource]. URL: https://publications.iadb.org/en/database-political-institutions-2020-dpi2020 (Accessed: 29.07.2024).
- List of countries by system of government. [Electronic resource]. URL: https://en.wikipedia.org/wiki/List_of_countries_by_system_of_government (Accessed: 29.07.2024).
- Bell, A., Fairbrother, M., & Jones, K. (2019). Fixed and random effects models: making an informed choice. Quality & quantity, 53, 1051-1074.
- Jones, Kelvyn. (2019). Re: How to deal with multicollinearity in fixed effect estimation (Panel Data)?
- Heisig, J. P., Schaeffer, M., & Giesecke, J. (2017). The costs of simplicity: Why multilevel models may benefit from accounting for cross-cluster differences in the effects of controls. American Sociological Review, 82(4), 796-827.
- Fixed and Random Effects Models. // Daniel Lüdecke, May 22, 2019. [Electronic resource]. URL: https://strengejacke.github.io/mixed-models-snippets/random-effects-within-between-effects-model.html Accessed: 29.07.2024).
- Ibid.
- Package ‘nlme’. [Electronic resource]. URL: https://cran.r-project.org/web/packages/nlme/nlme.pdf Accessed: 29.07.2024).