
Living standard indicators
Among the most important values of social democrats, the standard of living plays a key role. But how is it expressed? How do we measure a person's quality of life? Without a clear understanding of the criteria used to evaluate it, we can hardly make progress in implementing social democratic policy. So, let us try to figure it out.
There is a large number of living standard indicators, and attempts are sometimes made to include among them those that in no way reflect the standard of living, financial security, and wealth of citizens (for example, the growth of the birth rate, which only indirectly and weakly affects the life of an ordinary citizen). This article lists only those indicators that testify to how successfully human needs are met in a country.
From the point of view of social democrats, it is precisely the living standard indicators that demonstrate how great a country is. A country that has the most weapons, but whose citizens are unhappy and destitute, is not a great power. It is a parody of a great power.
The indicators in our article are not arranged in descending order of importance. Setting a descending order here is incorrect, since it depends on the specific situation and the severity of a particular indicator. Suppose that if all indicators in a country are at the highest level, but child mortality is 100%, then this flaw cancels out all the others. Another example: if the average wage in a country is $2000 a month, this only looks good at first glance; here one must definitely look at social inequality indicators — it is possible that 99% of the national income is received by 1% of the population, and then in reality the wages of the majority of citizens will be significantly lower. In other words, the standard of living can only be considered systemically; otherwise, we get a distorted picture.
Contents
Main indicators
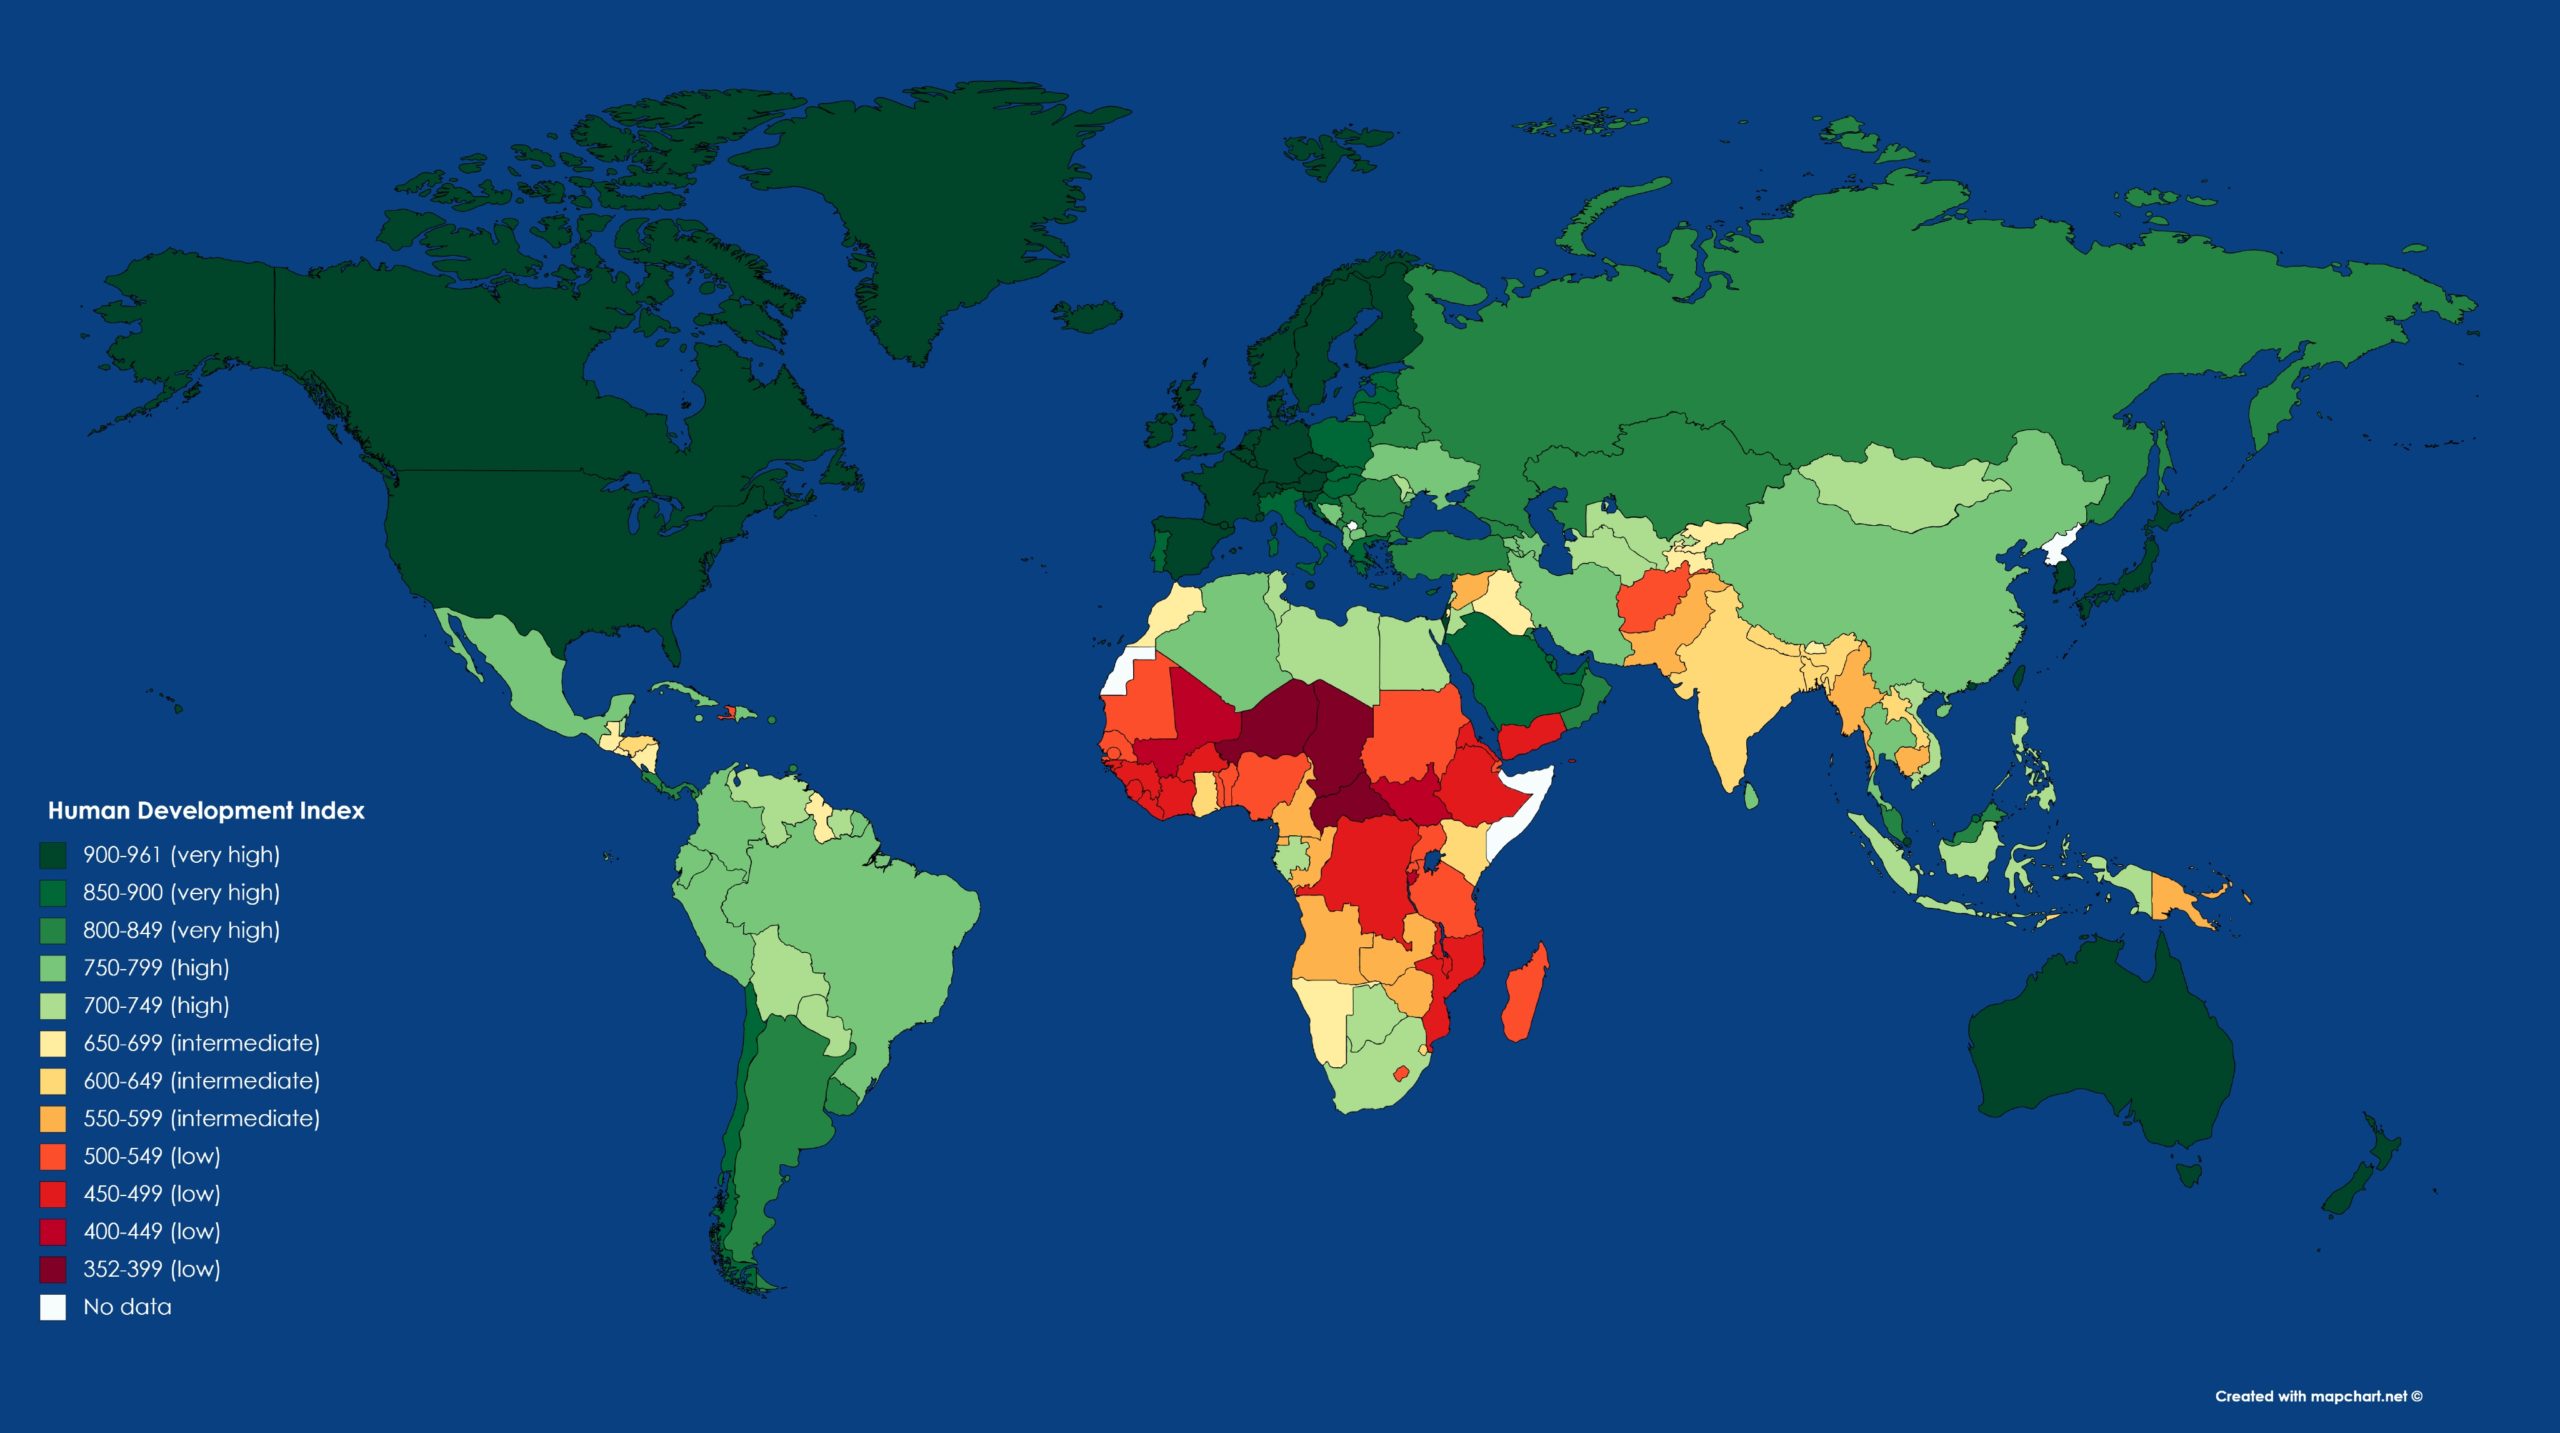
Most often, the standard of living is judged by two main indicators. The first is the Human Development Index (HDI), that is, a summary composite index that measures a country’s average achievements in three basic dimensions of human development — a long and healthy life, knowledge, and a decent standard of living1. It was first developed by Pakistani economist Mahbub ul Haq in collaboration with Nobel laureate Amartya Sen and other leading development thinkers, and was introduced in the background papers for the first Human Development Report in 1990. Its introduction served as an alternative to traditional measures of national development, such as income level and rates of economic growth. In its calculation, indicators (indices) are used that show achievements in terms of health status, education, and actual income of its citizens, across three main dimensions, for which their own indices are assessed:
- Life Expectancy Index: a long and healthy life, as measured by life expectancy at birth;
- Education Index: access to knowledge, as measured by expected years of schooling for children of school-entry age and mean years of schooling for the adult population;
- Gross National Income Index: a decent standard of living, as measured by Gross National Income (GNI) per capita in US dollars at purchasing power parity (PPP).
In particular, the HDI is calculated as the arithmetic mean of the indices of the three indicators:
HDI = (I1+ I2 +I3) / 3
These three dimensions are standardized into numerical values from 0 to 1, the arithmetic mean of which represents the aggregate HDI indicator in the range from 0 to 1. States are then ranked on the basis of this indicator.
In the final ranking, all states are ranked on the basis of the HDI and categorized into four groups in accordance with the established tiers:
- Countries with very high HDI (greater than 0.9);
- Countries with high HDI (from 0.8 to 0.9);
- Countries with medium HDI (from 0.5 to 0.8);
- Countries with low HDI (less than 0.5).
In 2020, the top ten HDI leaders looked as follows: Norway, Ireland, Switzerland, Hong Kong, Iceland, Germany, Sweden, Australia, Netherlands, Denmark2. Russia ranked 52nd in the rating.
The second indicator that can speak to the standard of living is GNI per capita (gross national income — the total value of all goods and services produced during the year within the state, plus income received by citizens of the country from abroad, minus income remitted out of the country by foreigners). As economist Ha-Joon Chang notes, “Per capita income is usually measured by GNI (or its product equivalent, GNP) per capita and is, in many people’s view, the best single indicator of a country’s living standard”3. Granted, it says more about the level of prosperity than about the level of development as a whole. In 2020, the highest GNI per capita was in Macao, Qatar, Singapore, Bermuda, Luxembourg, Switzerland, UAE, Ireland, Brunei, and the United States4. As we can see, most of the “hit parade” was occupied by small or microstates. Without them, the list would be: Switzerland, UAE, Ireland, United States, Norway, Denmark, Netherlands, Austria, Sweden, and Belgium. Russia ranks 54th in this list.
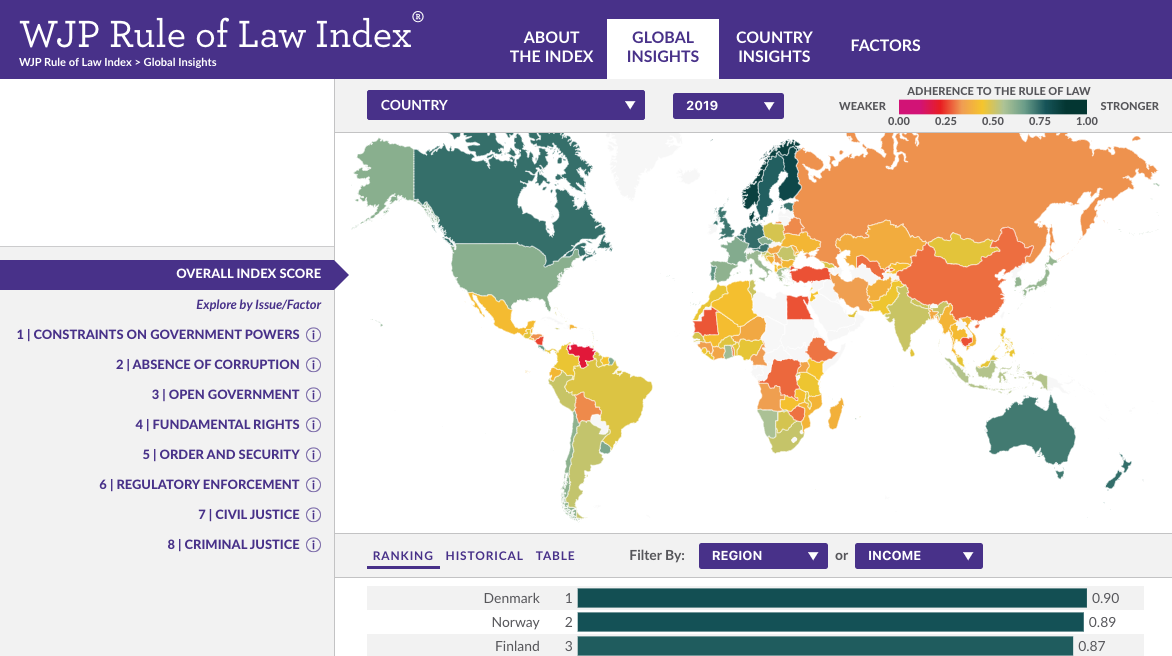
Social democrats consider the Rule of Law Index to be one of the most important indicators of the standard of living5. After all, the more independent the courts and legal system are, the more a person is protected from arbitrariness, crime, and plunder, which ultimately raises their standard of living. This index shows how well people are protected from elites and the state. Roughly speaking, with the maximum level of the rule of law, the poorest and least influential citizen can win in court against the richest and most influential one if the latter has broken the law. Conversely, with a low level of the rule of law, the wealthy and powerful can break the law and oppress others, which, of course, negatively affects the lives of most of society. Here, too, there is a top ten for 2020 — Denmark, Norway, Finland, Sweden, Germany, Netherlands, New Zealand, Luxembourg, Austria, and Ireland. Russia ranks 101st.
An important indicator is the Social Progress Index. It does not take into account economic achievements like GDP volume and sets out to measure outputs rather than inputs, since a person living in a given country does not care how much money their government spends on healthcare, for example; they are only interested in the availability and quality of medical care. It evaluates many components — access to basic medical care, housing, ecosystem sustainability, and so on. In 2020, the top ten leaders in the ranking were Norway, Denmark, Finland, New Zealand, Sweden, Switzerland, Canada, Australia, Iceland, and the Netherlands6. Russia ranked 69th.
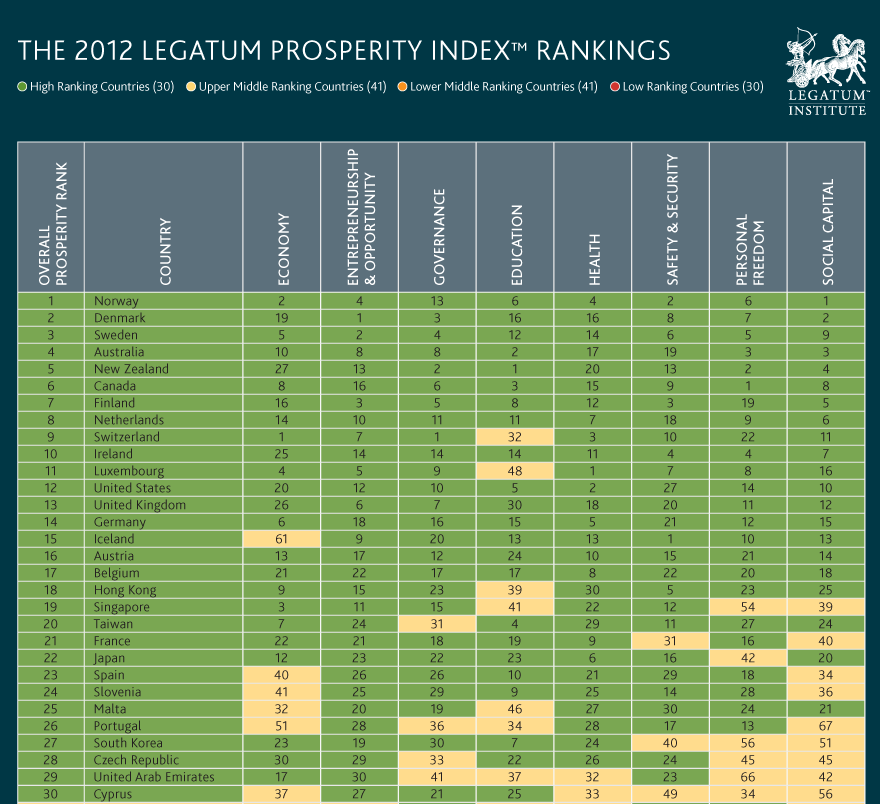
Another indicator claiming the status of a primary measure for determining the standard of living is the Legatum Prosperity Index, measured by the Legatum Institute. It consists of evaluating numerous indicators, including economic ones, assessments of education, health, safety, and so on7. The top ten leaders for 2020 are Denmark, Norway, Switzerland, Sweden, Finland, Netherlands, New Zealand, Germany, Luxembourg, and Austria8. Russia ranks 76th.
Consumption
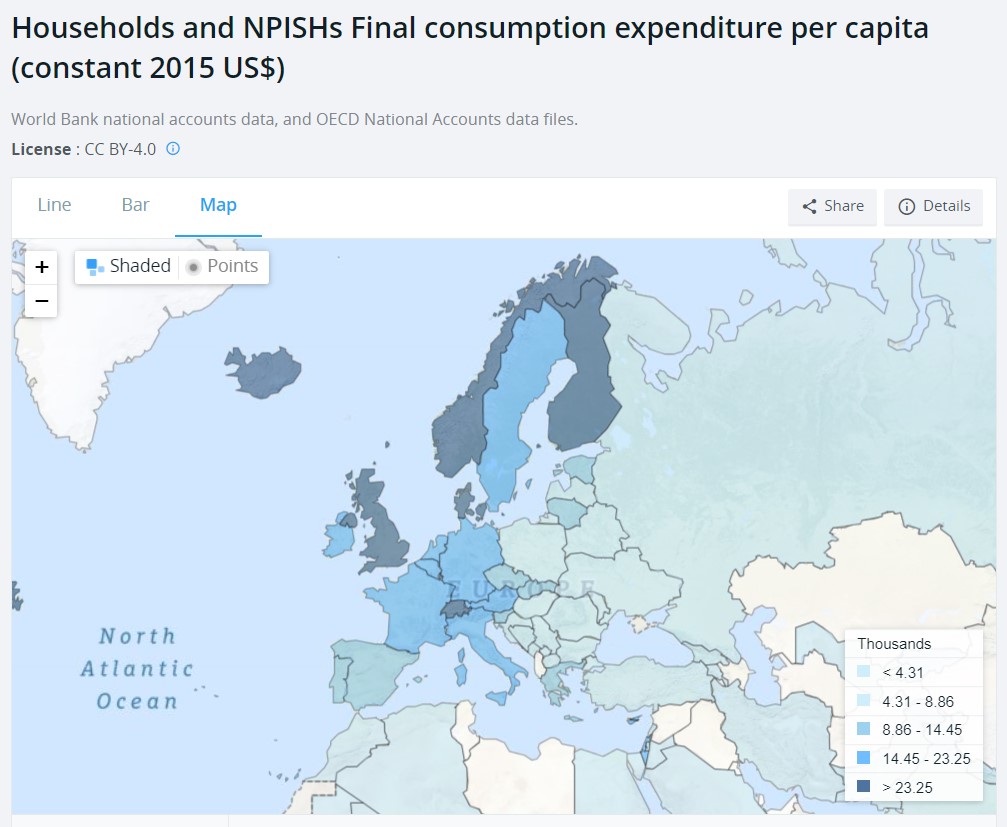
An important indicator of a high standard of living is the consumption of goods and services. Most people want to have a good house, car, appliances, and so on. But far from all countries see their desires fulfilled to a sufficient degree. What is most often meant by consumption? Consumption as an activity at the level of a specific subject (individual consumer) is “the use of beneficial properties of a given good, associated with satisfying personal needs of a person and expending (destroying) the value of this good”9. The consumption indicator, together with labor productivity, characterizes a country’s level of economic development. The overall level of consumption in a given country is determined by the achieved level of development of productive forces and the degree of social orientation of the country’s economy. The level of consumption can be demonstrated through statistical data showing household final consumption expenditure per capita on goods and services. For instance, such data is provided by the World Bank10.
A rather interesting way to determine the level of consumption is the so-called “iPhone Index”, compiled by the resource Picodi.com. It shows how long residents of different countries must work to afford the latest Apple iPhone11. In Switzerland, a person needs to work just 4.4 days for this, in Denmark and Norway — 6.9 and 7.2 days, respectively. In Russia, one needs to work 42.1 days to buy a new iPhone.
Incomes of the Population
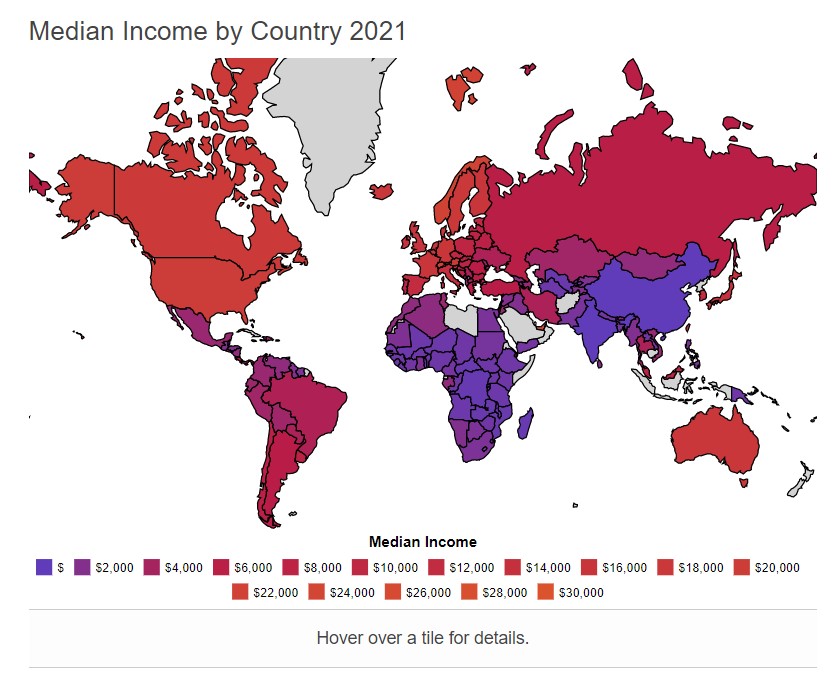
It is quite difficult to find information assessing wages across different countries, but data close to this can be found. The World Population Review portal, for example, calculates the average median family income in various countries (as the portal’s creators note, half of the families in a country have an income higher than the specified figure, and half — lower)12. The top ten world leaders by this indicator in 2021 are Luxembourg, Norway, Sweden, Australia, Denmark, United States, Canada, South Korea, Kuwait, and the Netherlands — from $52,493 to $39,584 per year per family. For comparison, in Russia this figure is $11,724 per year per family. According to data from the Numbeo portal, the top ten countries with the highest monthly income after taxes are Switzerland, Luxembourg, Singapore, Australia, United States, Denmark, Norway, Iceland, Qatar, and Hong Kong (from $6,159 to $3,061 per month)13. Russia ranks 60th in the world with $623 per month.
Defenders of authoritarianism attempt to explain this difference by claiming that in high-income countries “everything is more expensive”, but data from the same Numbeo shows that incomes in Switzerland are nearly 10 times higher than in Russia, while the cost of an average meal in an inexpensive restaurant is higher by only about 3.5 times14. In Sweden, the average salary ($2,964) is almost 5 times higher than in Russia, while the cost of the same meal is higher by only 1.4 times.
In Europe, the “at-risk-of-poverty rate” indicator is widely used15. It represents the percentage of the population with a net income (after receiving social transfers) of less than 60% of the median net income in the country. Note that this does not mean at all that the population in this category is poor. To a greater extent, this indicator serves as a measure of low income relative to other citizens. Often this indicator captures well the part of the population living paycheck to paycheck, that is, it refers to a state of affairs where a citizen has enough funds for all necessary goods and services. The absolute indicator of poverty is the “low income standard”. It applies to cases where a household lacks the funds to meet basic needs, such as housing costs, public transportation, child support, and so on. It should be noted that in Sweden, with an increase in the at-risk-of-poverty rate, a decrease in the low income standard is observed16. Specifically, while the at-risk-of-poverty rate rose from 7.3% in 1991 to 14.9% in 2017, the low income standard values fell from 9% in 1991 to 6% in 2017. That is, absolute poverty was significantly reduced.
The poverty line established in a state can also speak to the level of prosperity. Thus, in Russia in 2021, it amounted to 11,970 rubles per month17. In the US in the same year — $12,880 per year, or approximately 78,000 rubles per month18. In Germany around the same time — 1,074 euros per month, or approximately 92,000 rubles per month19. Those who earn below this amount are considered poor in Germany.
Working conditions
Even if citizens are very rich, there will be little benefit from this if they, say, work 12 hours a day without days off. Therefore, working conditions are one of the important indicators of the standard of living. There are indicators that clearly demonstrate working conditions. These are, for example:
- Annual working hours per person;
- Occupational fatality rate;
- Unemployment rate;
- Working conditions index.
So we need to evaluate annual working hours to get a full picture of how hard people work in different countries. Such data are available only for OECD member countries. Among them, the shortest annual working hours, as of 2011, are found in the Netherlands, Germany, Norway, and France. At the other extreme are countries with the longest annual working hours: South Korea, Greece, the US, and Italy. The OECD data include a number of countries that cannot be considered rich. In one of them—Mexico—annual working hours (2,250 hours) are even longer than in South Korea (2,090 hours). Chile, another developing country member of the OECD, stands at 2,047 hours per year, between Korea and Greece (2,039 hours)20.
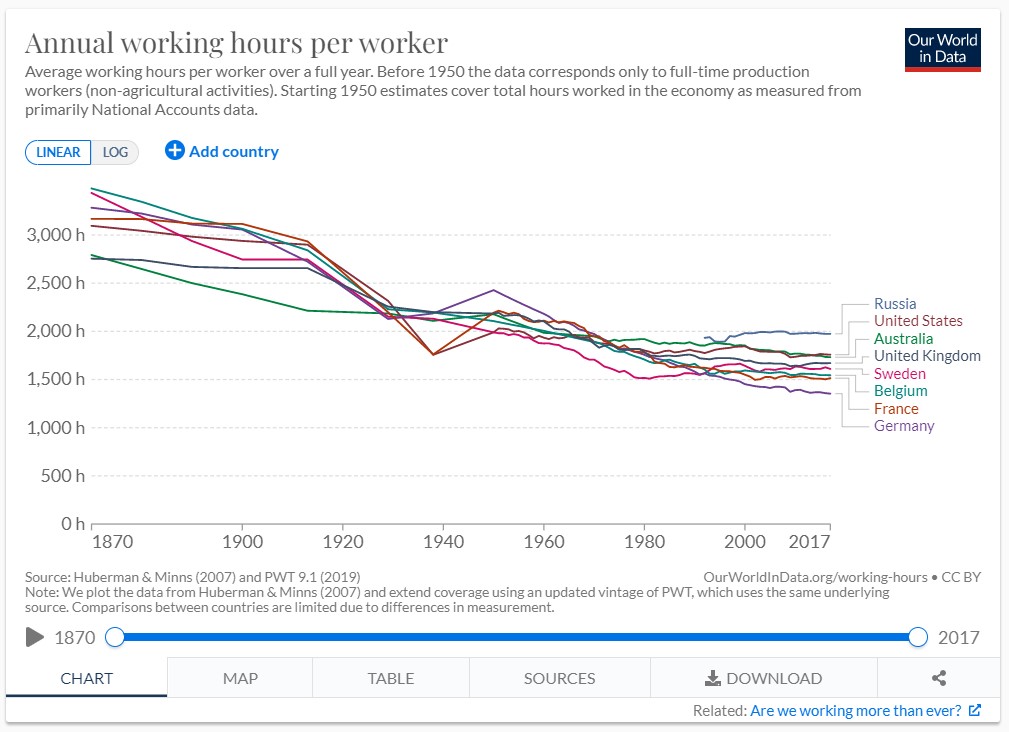
The Our World in Data portal calculates the average total number of hours citizens spend at work per year in a given country, taking into account various types of days off, vacations, and so on21. As we can see, in countries like Germany or Sweden, working hours per person are decreasing, while in Russia they remain at the level of the 1950s–60s in developed countries.
In terms of physical working conditions, the most readily available indicator is the fatal occupational injury rate (usually calculated per 100,000 workers). Countries like (in alphabetical order) Australia, Finland, Norway, Sweden, Switzerland, and the UK offer safe working environments, with only one or two people per 100,000 dying each year from work accidents. In El Salvador and India, the corresponding ratio is around thirty to forty, and around twenty in Ethiopia and Turkey. The figures for other developing countries for which data are available (they are often not available) range between ten and fifteen22.
Data from the World Health Organization shows the occupational fatality rate23. For Russia, data is available only up to 2006, when the indicator was 2 cases per 100,000 people. In Germany and Denmark it was 1.1, while in Finland, Sweden, and Norway it was 0.9, 0.8, and 0.7, respectively.
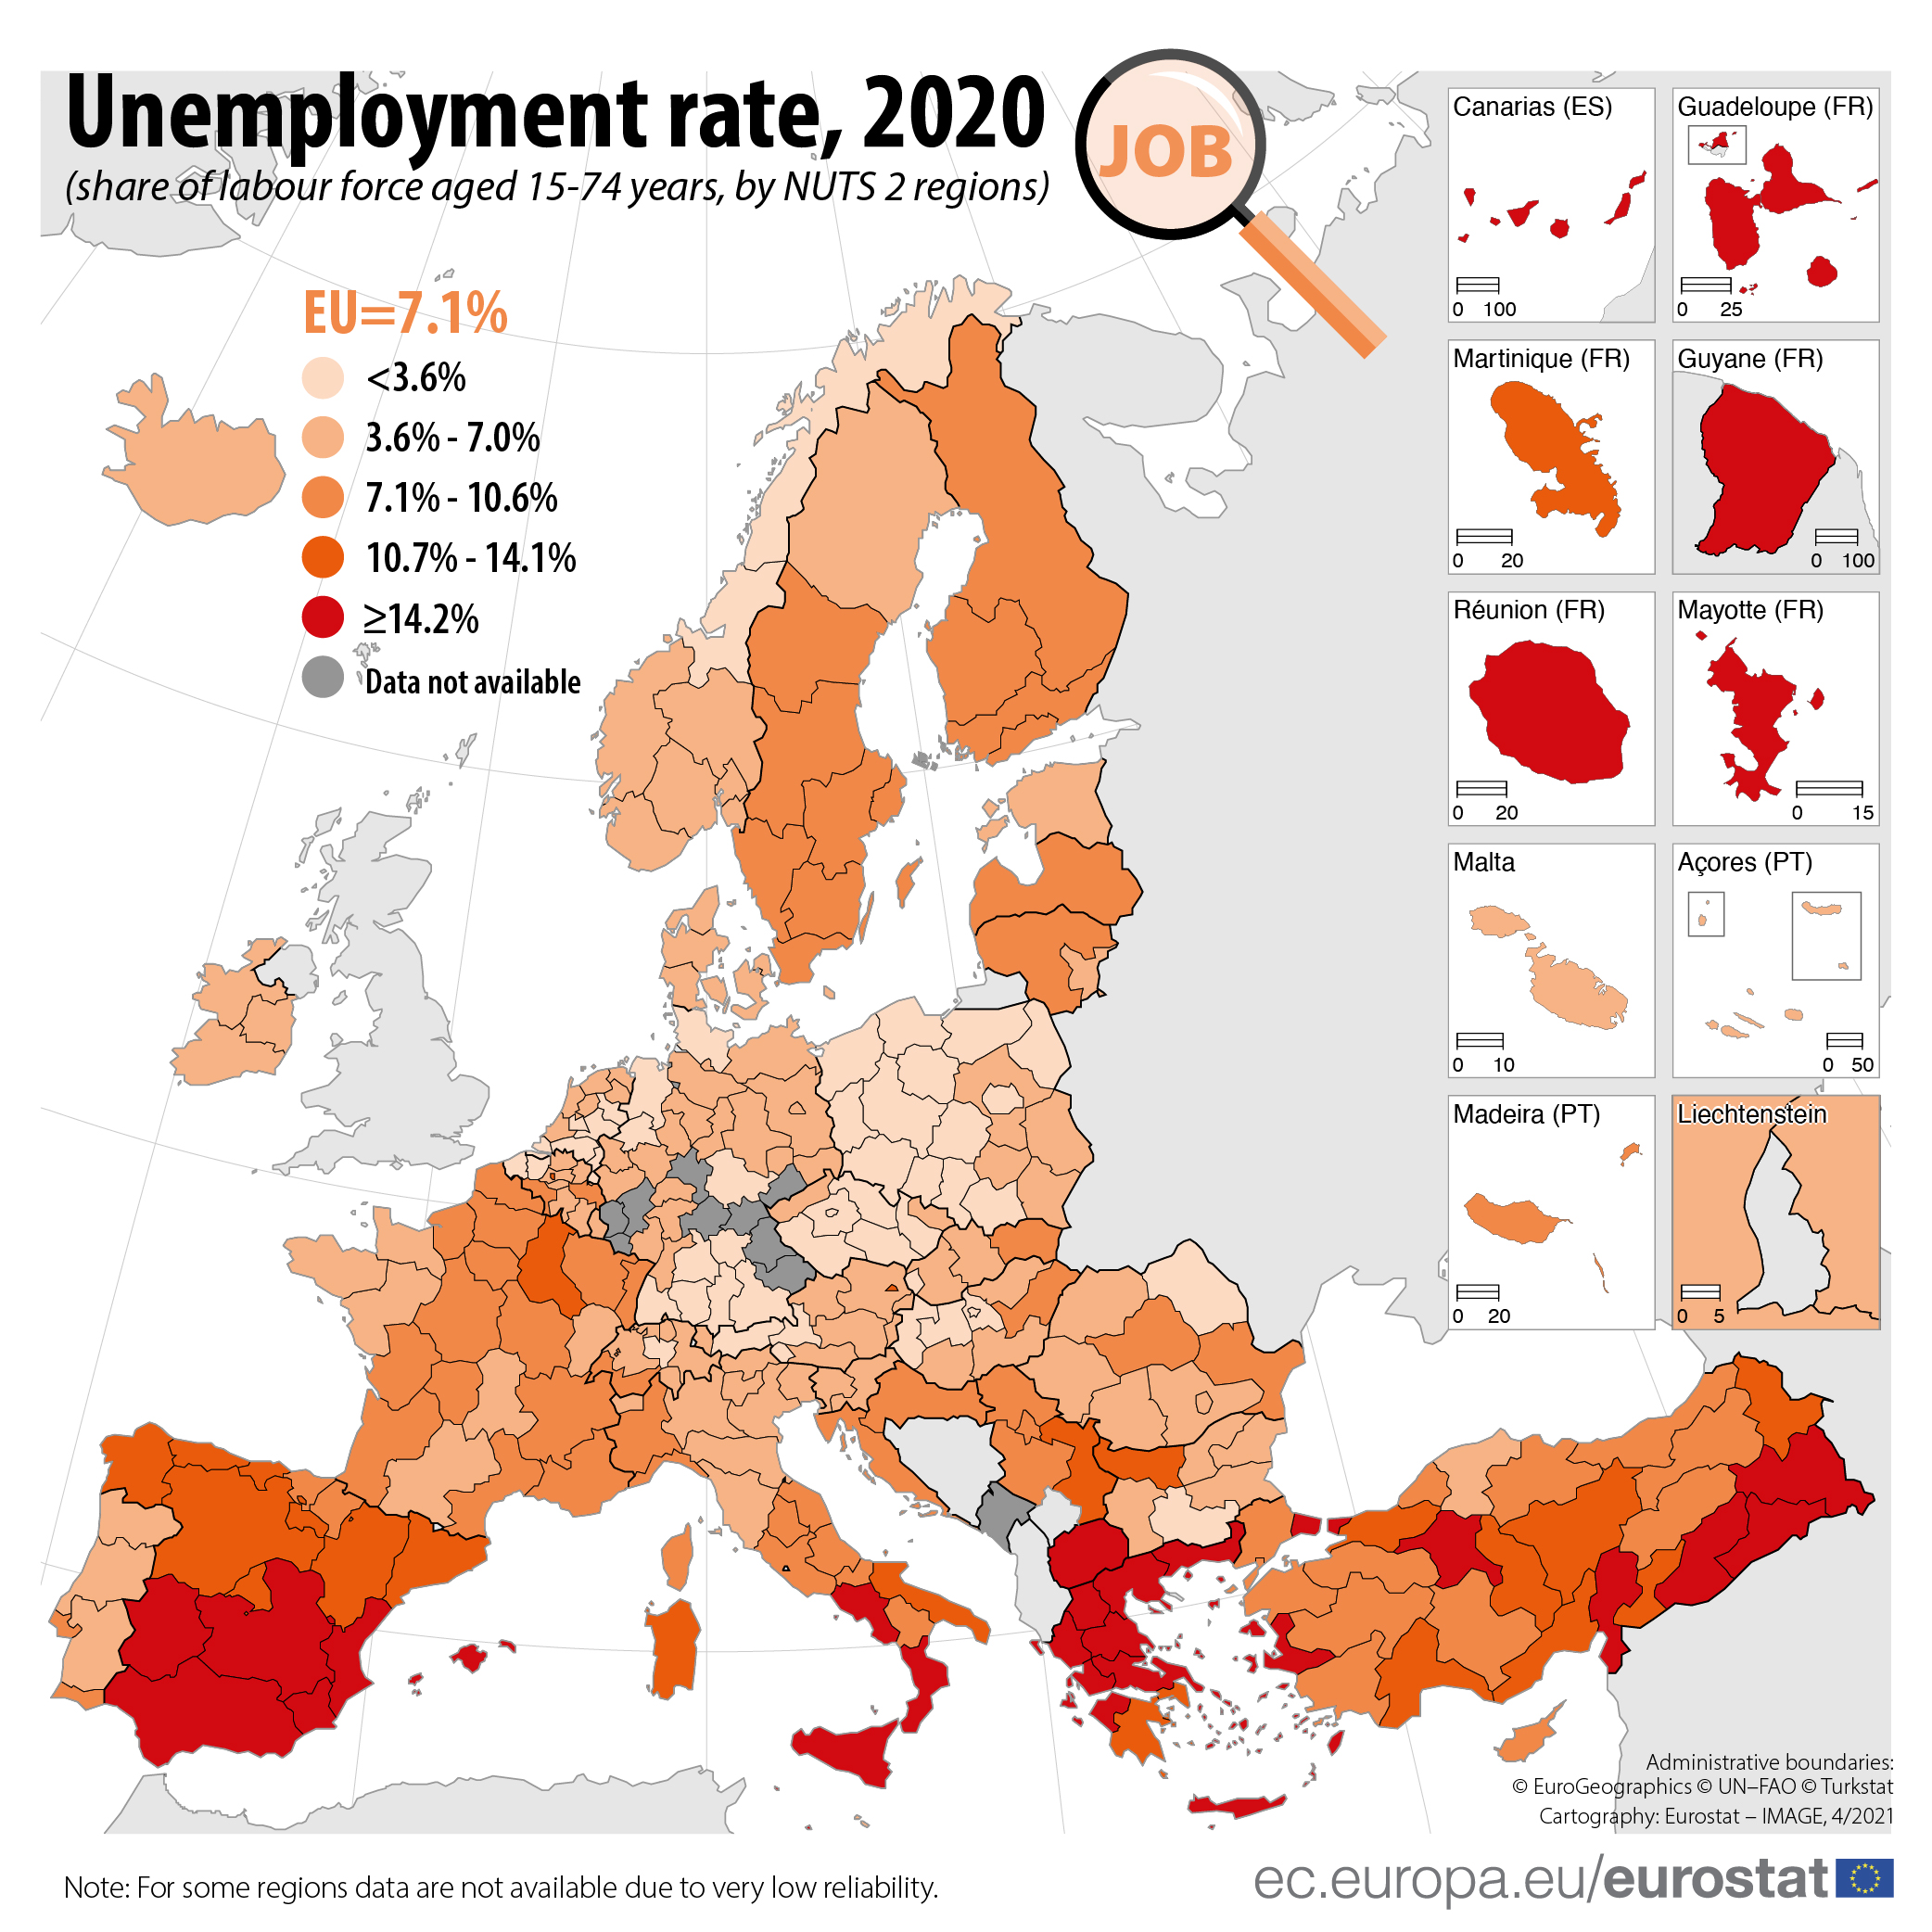
The unemployment rate is another indicator that affects the standard of living as a whole. Such statistics are kept by the World Bank24. It must be admitted that this is one of the few living standard indicators where conservative countries are slightly better off than social democratic ones. Although Norway, Germany, or Denmark have a fairly low rate (4.62%, 4.31%, and 5.66% in 2021), Spain’s is relatively high (15.67%), and while in Sweden and Finland it is not high (8.45% and 7.83%), it is still higher than in Russia (5.73%).
The World Economic Forum also calculated a working conditions index25, in which the top ten leaders included Sweden, Denmark, Finland, the Netherlands, Austria, Norway, Iceland, Belgium, Switzerland, and France. Russia ranked 32nd out of 82 countries.
Social inequality
The standard of living is also affected by the level of social inequality, since high inequality creates a sense of injustice, and a significant portion of people receives fewer benefits than they otherwise could. Ha-Joon Chang writes:
There are a few different ways to measure the degree of inequality in income distribution. The most commonly used indicator is the Gini coefficient, named after the early twentieth-century Italian statistician Corrado Gini.
<…>
Any country with a Gini coefficient above 0.5 can be considered very unequal… Roughly speaking, a Gini coefficient of 0.35 is the dividing line between relatively equal countries and those that are not.
<…>
Data on wealth inequality are much harder to come by and less reliable than those on income inequality. But it is clear that wealth inequality is much higher than income inequality in all countries, for a simple reason: accumulating wealth is much harder than earning income.
According to UNCTAD (UN Conference on Trade and Development), the wealth Gini coefficient for fifteen sample countries, ranging from poor countries like India and Indonesia to rich ones like the US and Norway, ranges between 0.5 and 0.8. The gap between income inequality and wealth inequality within a country is particularly large in European countries with low income inequality, such as Norway and Germany26.
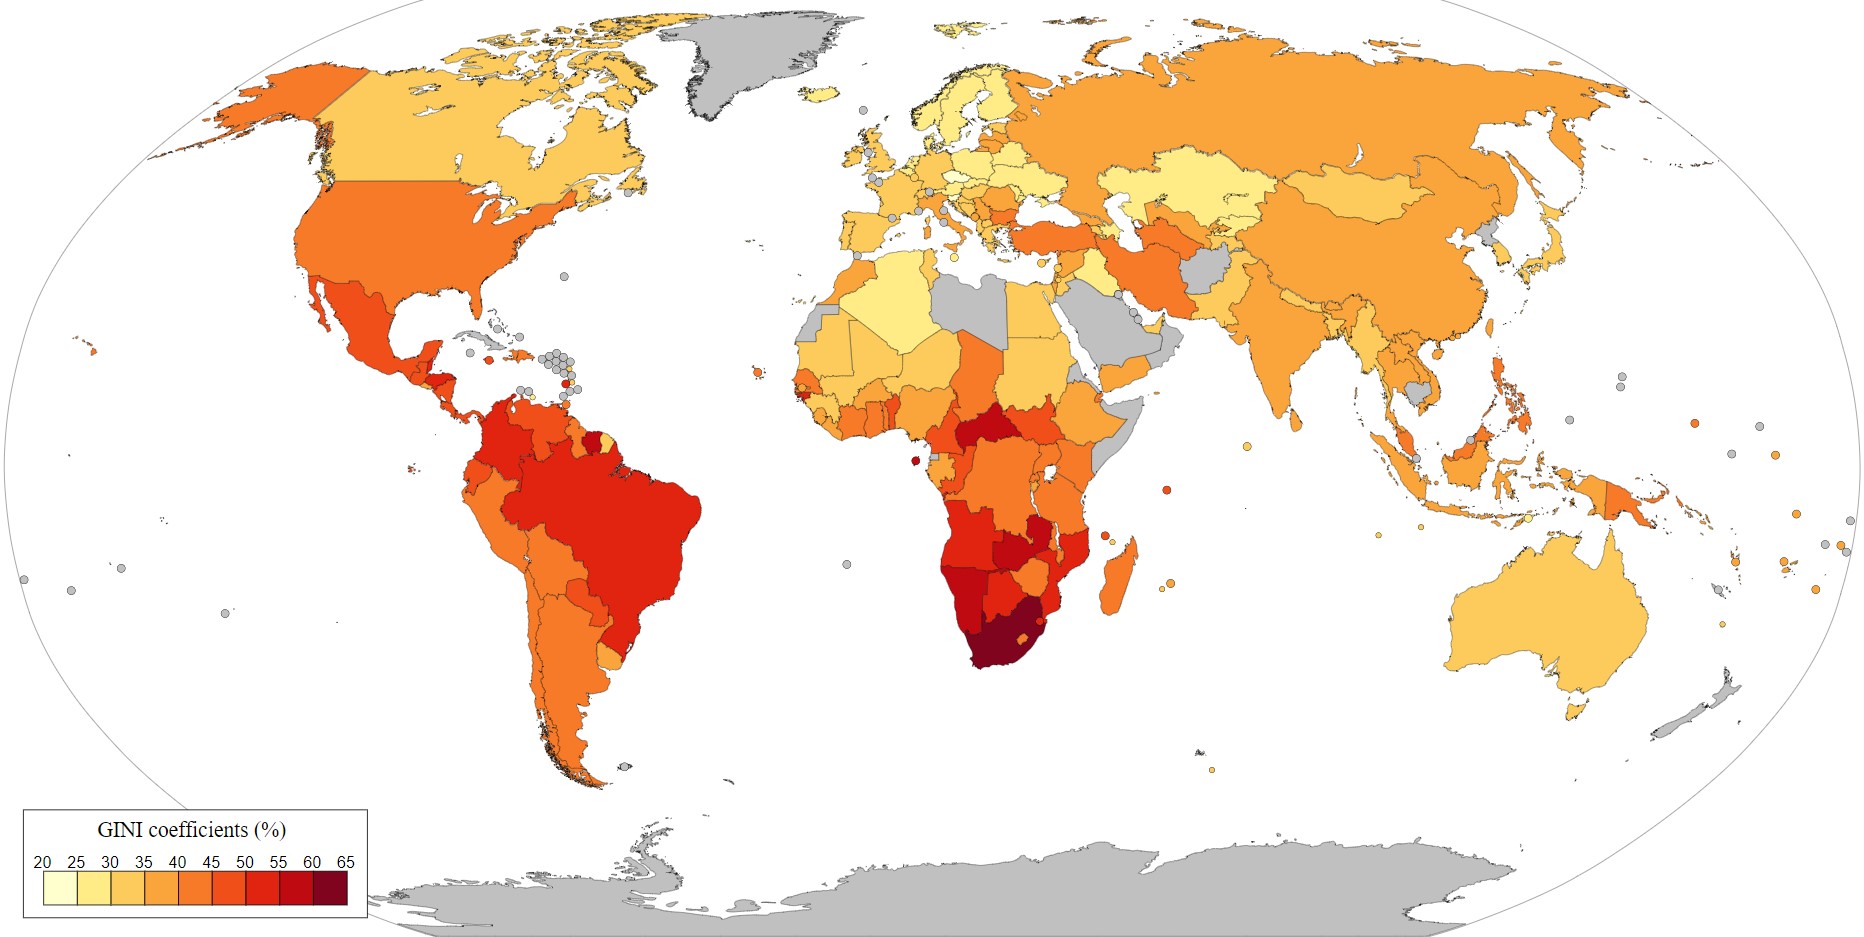
The Gini coefficient is calculated by the World Bank27. According to 2016 data, its figures in Germany, Sweden, Denmark, Norway, and Finland were 31.9, 29.6, 28.2, 28.5, and 27.1, respectively (Chang takes 1 as the maximum indicator, while the World Bank uses 100). Russia’s figure was 36.8. However, Chang correctly noted that this includes only income inequality, without taking into account wealth inequality or inequality in privileges, which are extremely difficult to calculate. Therefore, the Gini index cannot be considered an indicator that fully satisfies the task of measuring inequality.
There is also another indicator — the Palma ratio28:
More recently, my Cambridge colleague Gabriel Palma has proposed using the ratio between the income share of the top 10 per cent and that of the bottom 40 per cent as a more precise — and simpler to calculate — measure of a country’s income inequality. Pointing out that the share of income held by the middle 50 per cent of the population is remarkably similar across countries, regardless of policy, Palma argues that by looking at the ratio between the extreme ends of the population, which differs much more across countries, we can get a quicker and sharper assessment of the degree of inequality across different countries. Known as the Palma ratio, this number overcomes the excessive sensitivity of the Gini coefficient to changes in the middle of the income distribution, where in any case it is much harder to change things through policy intervention29.
There is also an indicator such as the Social Mobility Index, calculated by the World Economic Forum30. Low social mobility limits a person’s opportunities, which remain tied to their socioeconomic status at birth: those born into poor and uneducated families remain poor and uneducated. The Social Mobility Index is calculated based on ten socioeconomic parameters: health, access to education, educational quality and equity, lifelong learning opportunities, technology access, work opportunities, fair wages, working conditions, social protection, and the efficiency and openness of public institutions. The top ten leaders in this index are Denmark, Norway, Finland, Sweden, Iceland, the Netherlands, Switzerland, Austria, Belgium, and Luxembourg. Russia ranks 39th among 82 countries.
Safety
Crime rates are quite difficult to calculate, as different countries have different criteria for what constitutes a crime and how to count them, along with varying clearance rates. One indicator that can tell us a lot about the crime level and is relatively easy and straightforward to count is the number of intentional homicides per 100,000 people. This indicator is calculated by the World Bank31. The lowest figures belong to microstates like Monaco or San Marino, but we can see that in social democracies these figures are also low. For example, in Norway in 2018 it was 0.47, in Sweden — 1.08, in Denmark — 1.01, and in Germany — 0.95. For comparison, in Russia this indicator was 8.21, in Turkey — 2.59, in Argentina — 5.32, and in Venezuela — 36.69.

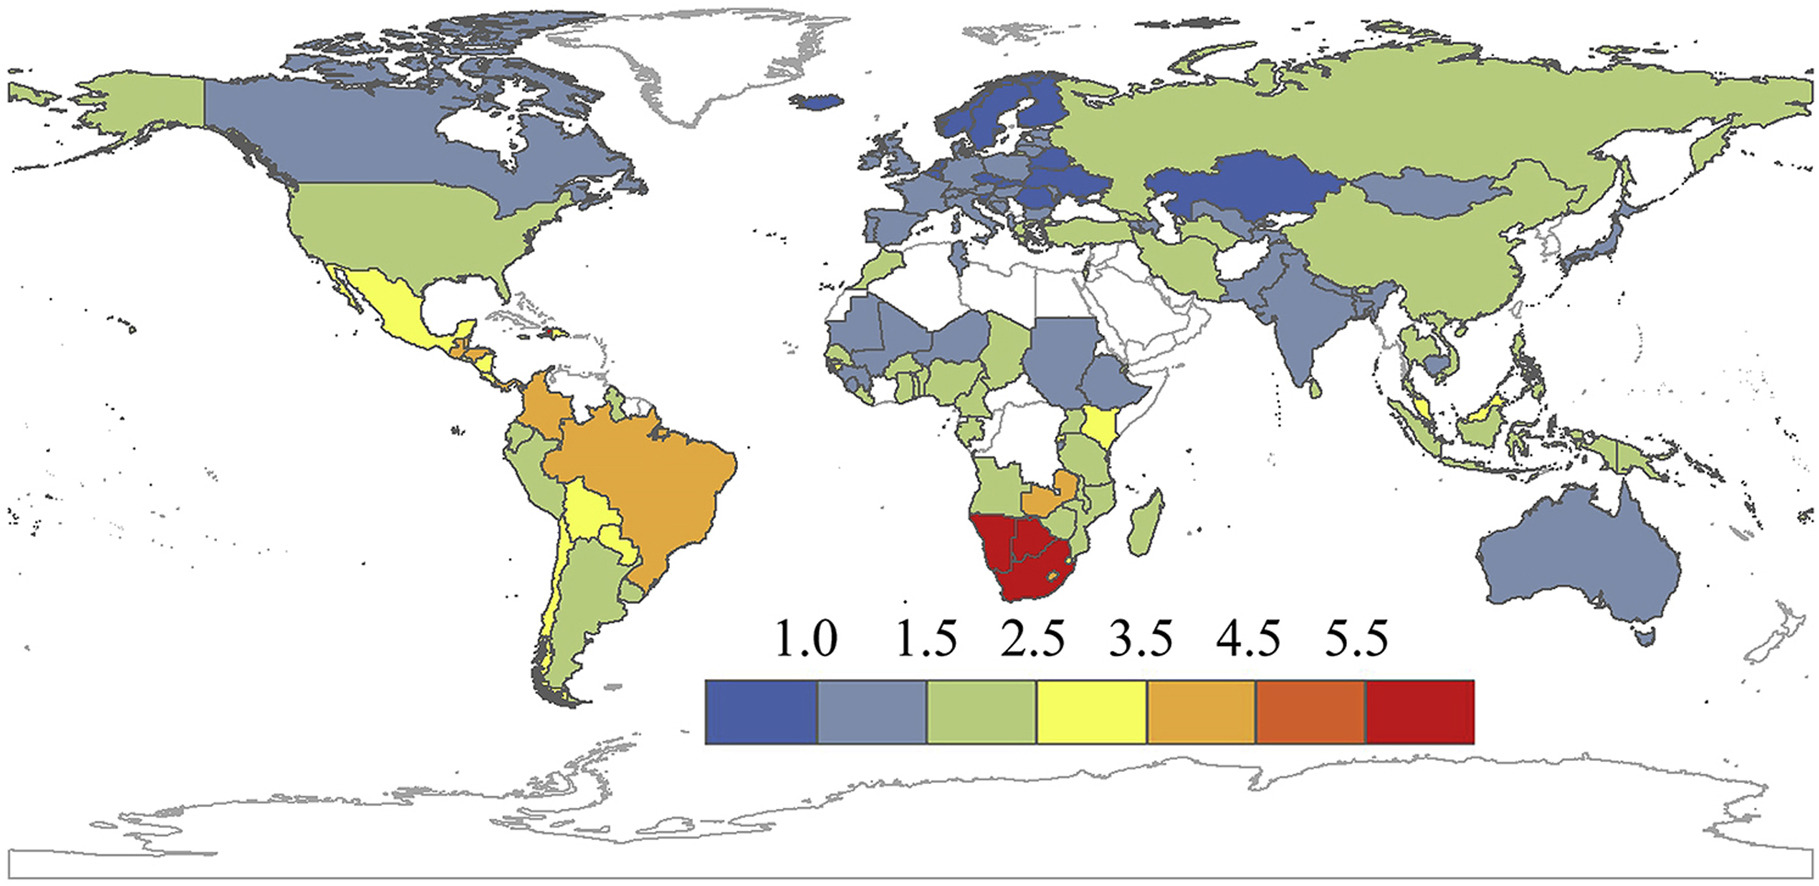
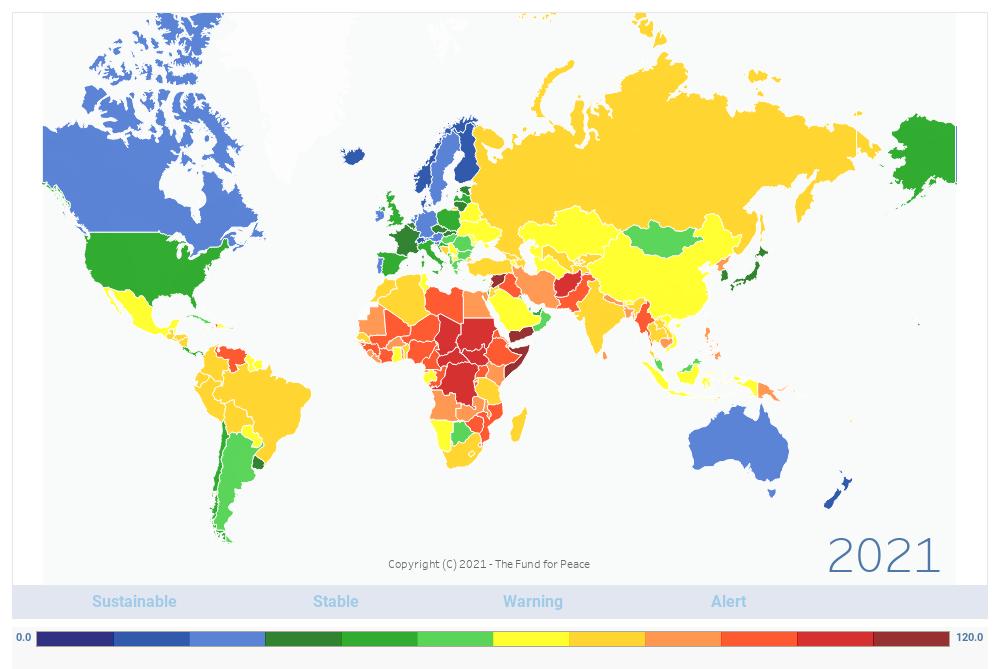
A rather unusual indicator is the Fragile States Index. It is designed to assess the inability of authorities to control the integrity of their territory, as well as the demographic, political, and economic situation in the country. Its essence is that in countries where the situation is assessed as dangerous, the likelihood of wars (including civil ones), riots, state loss of control over the economy (with accompanying catastrophes), or loss of the ability to provide quality services to citizens is much higher. The most sustainable states in 2021 were Finland, Norway, Iceland, New Zealand, Denmark, Switzerland, Luxembourg, Sweden, Canada, and Australia32. Russia ranked 74th out of 179 (the higher the value, the better the situation — the leading Finland ranks 179th). The safety of the environment in a country can also be indicated by the so-called Global Peace Index, which characterizes the level of safety of living in countries and regions, taking into account both internal factors — for example, the level of violence in the country and crime — and external ones — the country’s international relations, military spending, and other parameters. The leaders of the Global Peace Index in 2021 were Iceland, New Zealand, Denmark, Portugal, Slovenia, Austria, Switzerland, Ireland, the Czech Republic, and Canada33. Russia ranked 154th out of 163 countries.
Infrastructure
How can one determine the quality of infrastructure and the competence of the state in this area? Doing this with the help of statistical indicators is not easy. One of the few indicators here is the quality of road infrastructure according to the World Economic Forum34, calculated in 2020. The top ten leaders in this ranking are as follows: UAE, Singapore, Switzerland, Hong Kong, Netherlands, Japan, France, Portugal, Austria, USA. Social democracies occupy high places in this ranking, as we can see with Switzerland or Austria. Denmark ranks 13th, Germany 15th, Sweden 18th. Russia ranks 114th out of 137.
It is difficult to judge the level of medical provision in a country, but life expectancy at birth helps us indirectly. Thus, in 2019, the leaders in this indicator were Japan (84.5 years), Switzerland, South Korea, Singapore, Spain, Cyprus, Australia, Italy, Israel, and Norway (82.6 years)35. Russia ranked 96th here.

Freedoms
The standard of living is also affected by the level of freedoms. A person feels uncomfortable if what is permitted in developed countries is forbidden to them, if they cannot influence their destiny by electing their political representatives, if they are forbidden to write the truth, if they are forbidden to engage in business, and so on. And there are several indices that reflect the level of these freedoms — these are the indices of democracy, press freedom, human freedom, and economic freedom.
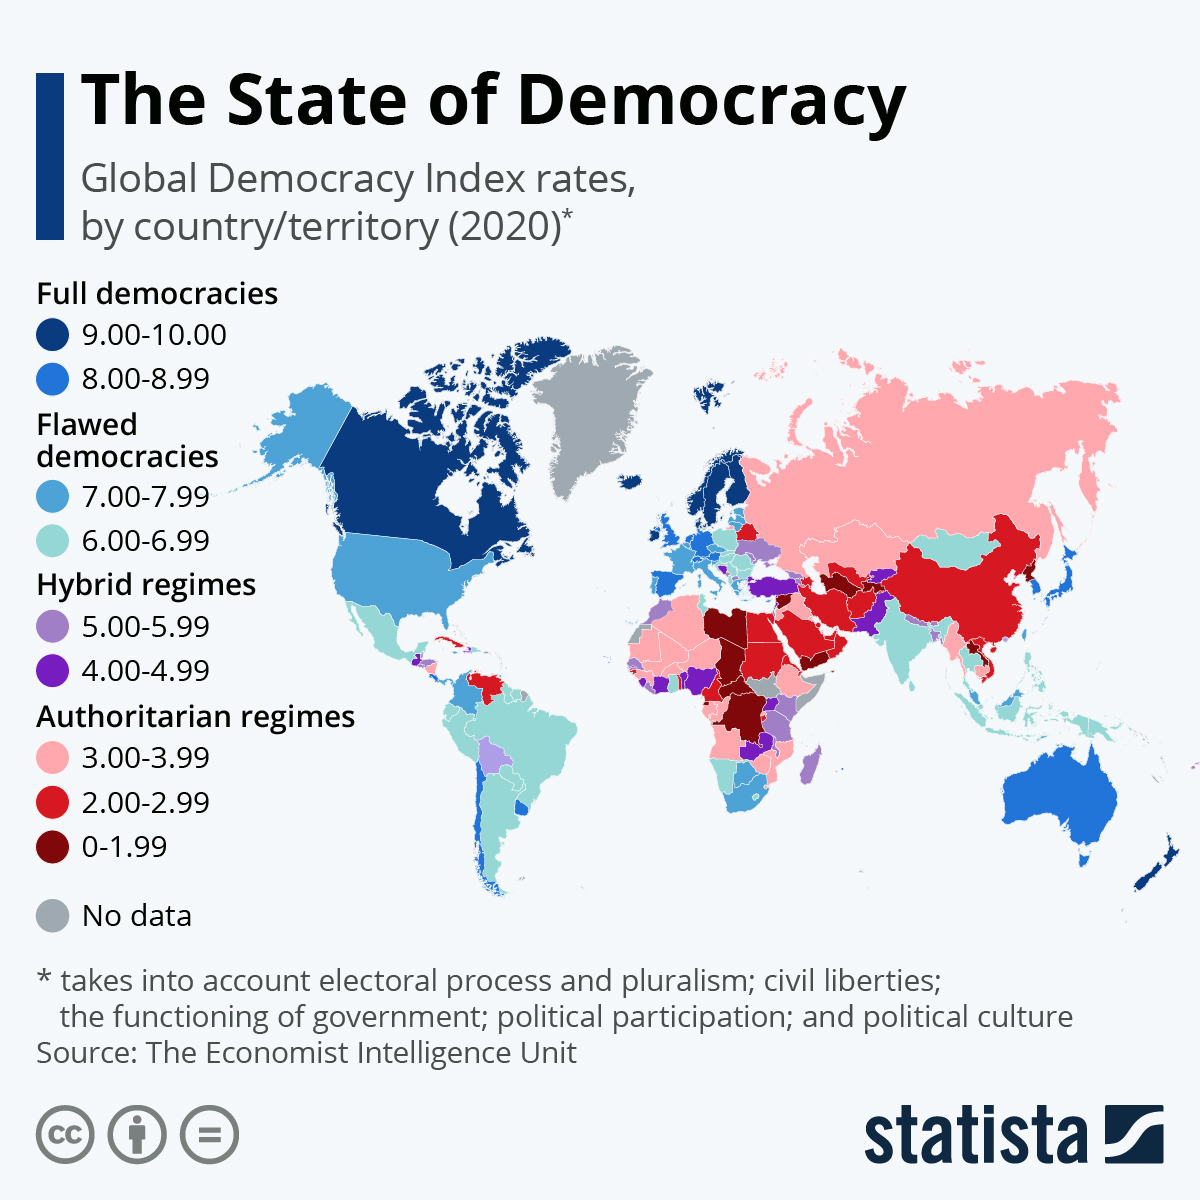
The most authoritative democracy index today is the index from The Economist magazine36. Its compilation takes into account 60 different indicators grouped into 5 categories: electoral process and pluralism, civil liberties, the functioning of government, political participation, and political culture. In 2020, the top ten leaders of this index were Norway, Iceland, Sweden, New Zealand, Canada, Finland, Denmark, Ireland, Australia, and the Netherlands. Russia ranked 124th in the ranking.
The Press Freedom Index is compiled by the organization Reporters Without Borders37. It represents a community of organizations acting in the interests of defending press freedom and the rights of journalists. The index evaluates the degree of freedom that journalists and news organizations, including print, broadcast, and online media, enjoy in a given country, as well as the efforts of the authorities to respect and ensure respect for this freedom. It also takes into account the number of acts committed against journalists during a given period. The ten countries with the most free media in 2021 are Norway, Finland, Sweden, Denmark, Costa Rica, Netherlands, Jamaica, New Zealand, Portugal, and Switzerland. Russia ranked 150th.
The Human Freedom Index is calculated by the Cato Institute. The index measures the state of freedom based on a broad measure encompassing personal, civil, and economic freedom, and is calculated based on 76 distinct indicators reflecting 12 areas of life and activity (including legal system and property rights, sound money, freedom to trade internationally, regulation of business, and so on). The top ten leaders in the 2020 report38: New Zealand, Switzerland, Hong Kong, Denmark, Australia, Canada, Ireland, Estonia, Germany, Sweden. Russia was located at 115th place.
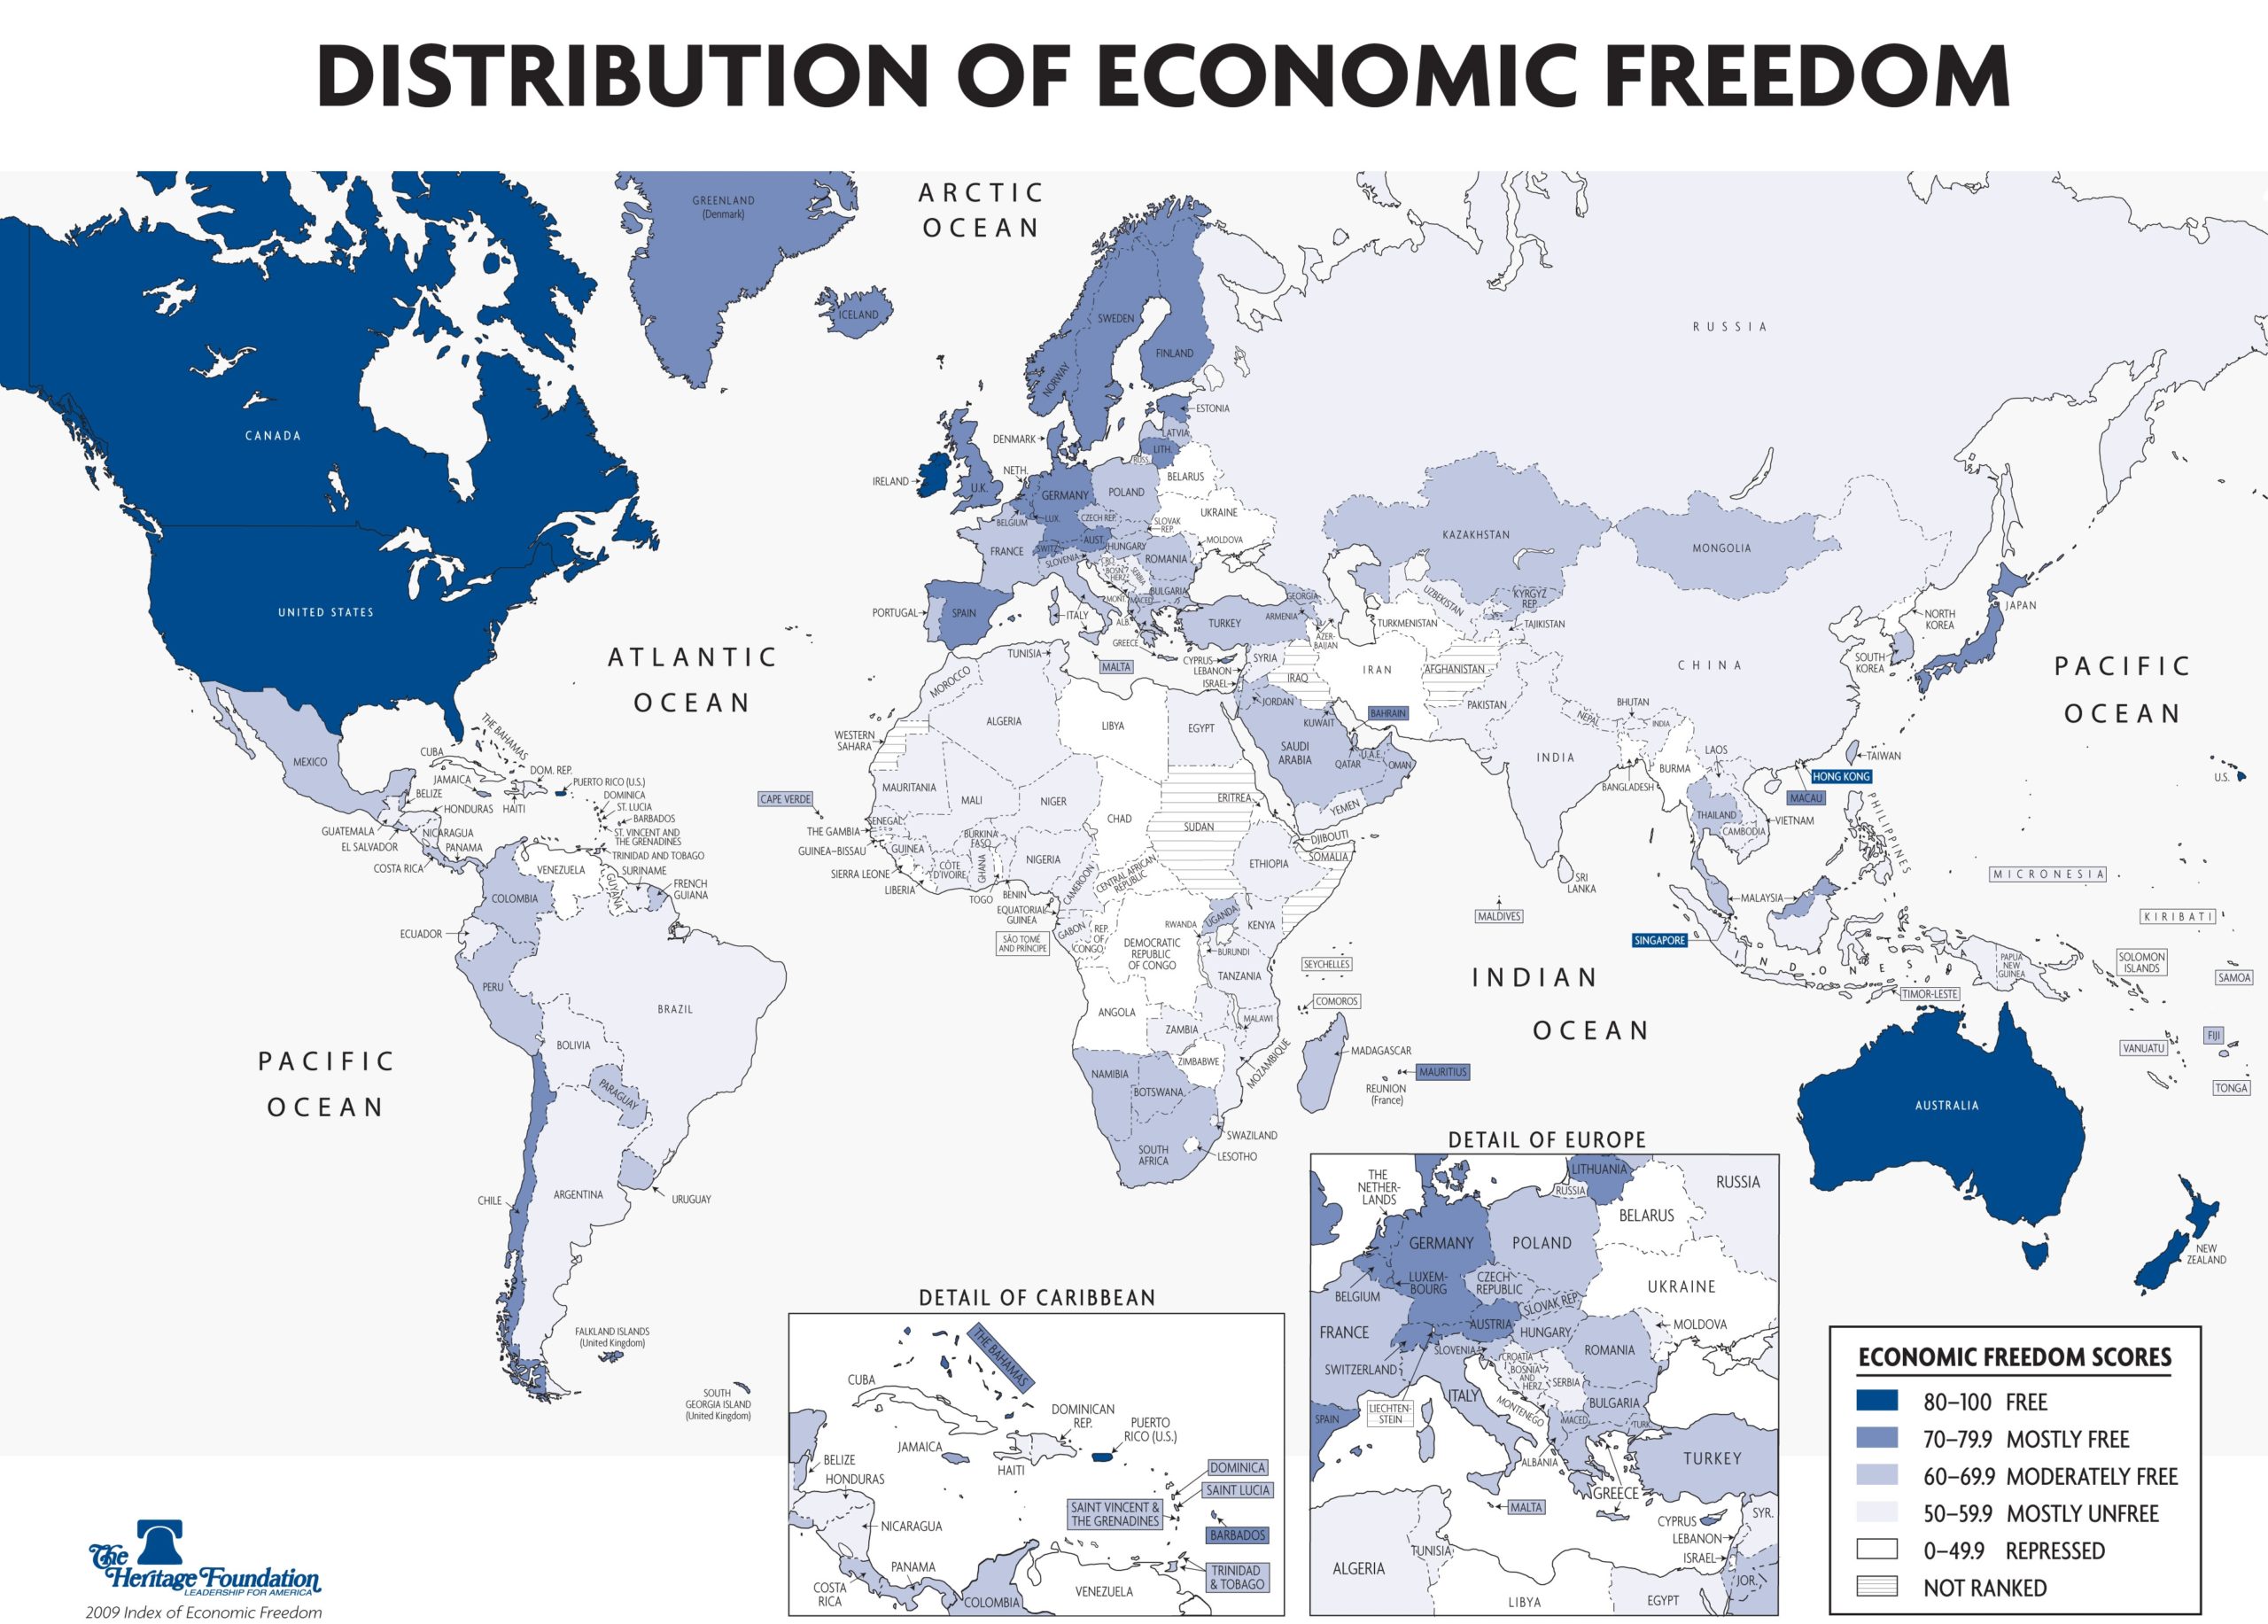
The Index of Economic Freedom39 is calculated by the Wall Street Journal and the research center Heritage Foundation. This index speaks to how freely citizens can start their own business and at the same time are protected from big business and officials. In 2021, the top ten leaders in the ranking include Singapore, New Zealand, Australia, Switzerland, Ireland, Taiwan, United Kingdom, Estonia, Canada, Denmark. Russia ranks 92nd.
A very important indicator of freedoms is a low number of people living in conditions that can be classified as slavery. Measuring this is handled by the Global Slavery Index. Social democratic countries are in the top ten countries with the lowest indicator of the number of people living in slavery. Russia is consistently among the top ten countries with the highest number of slaves per capita40.
Other
In addition to those listed above, there are also other indicators that can speak to the standard and quality of life in various countries. For example, the World Economic Forum compiled a report on health41 in various countries, where the top ten leaders were Cyprus, Switzerland, Japan, Sweden, Netherlands, Malta, Singapore, France, South Korea, and Iceland. Norway, Denmark, and Finland also made it into the top 15 countries. Russia ranked 43rd.
The same World Economic Forum also provided data on education quality and equity42, technology access43, and finally, the level of inclusive institutions overall44. Education is extremely important for the standard of living, because the ability to find a high-paying job, and accordingly — to provide oneself with a livelihood — largely depends on it. The top ten leaders here were Sweden, Denmark, Iceland, Singapore, Norway, Austria, Finland, Latvia, Lithuania, and Canada (Russia in 32nd place). The level of access to technology shows how well people in the country are equipped with modern devices and internet access, which is extraordinarily important for their access to information45. Here the top 10 looks like this: Denmark, Iceland, South Korea, Sweden, Switzerland, USA, Norway, Estonia, New Zealand, Netherlands (Russia in 44th place). The leaders in the overall level of inclusive institutions were New Zealand, Luxembourg, Switzerland, Finland, Singapore, Norway, Sweden, Denmark, Iceland, Netherlands (Russia — 76th). The ranking of national higher education systems by the organization Universitas21 can also speak to the level of education. In 2020, the measurement was conducted across 50 countries, and the best were the USA, Switzerland, Denmark, Singapore, and Sweden46. Russia took 35th place.
the Better Life Index, introduced by the OECD in 2011. This looks at people’s subjective assessments of their life satisfaction, alongside a dozen other more (if not completely) objective indicators, ranging from income and jobs to community and work-life balance (and each of them has more than one component)47.
The Better Life Index is based not on statistical indicators, but on surveys of people, essentially showing how satisfied they are with life in a country. Unfortunately, it covers only 40 countries worldwide. The top five leaders in 2020 were Norway, Australia, Iceland, Canada, and Denmark48. Russia ranked 33rd out of 40 countries. The Gallup happiness index is calculated on similar principles; however, in 2020 it already covered 153 countries, with the top spots taken by Finland, Denmark, Switzerland, Iceland, Norway, the Netherlands, Sweden, New Zealand, Austria, and Luxembourg49. Russia ranked 73rd. There is also a similar World Happiness Report compiled by the UN. To evaluate national happiness, it uses 6 factors: GDP per capita, social support, healthy life expectancy, freedom to make life choices, generosity, and perceptions of corruption. Each factor is evaluated on a 10-point scale. In the 2021 report, the top spots were occupied by Finland, Iceland, Denmark, Switzerland, the Netherlands, Sweden, Germany, Norway, New Zealand, and Austria50. Russia ranked 60th out of 95 countries.
But some — the Nordic countries (especially Denmark), Australia and Costa Rica — tend to do well in a larger number of happiness indices than other countries. A few countries, such as Mexico and the Philippines, tend to do better in indices where subjective factors are given greater weight, suggesting a high prevalence of false consciousness among their populations51.
The Numbeo portal also maintains a Quality of Life Index, which assesses a complex set of factors — purchasing power, housing prices, safety, and so forth. The top ten leaders are as follows: Switzerland, Denmark, Netherlands, Finland, Australia, Iceland, Austria, Germany, New Zealand, Luxembourg52. Russia ranks 70th out of 83 countries.
Since the majority of people value environmental quality, indicators of the Environmental Performance Index — which takes into account the level of air pollution, drinking water quality, and so on — also become important. In 2020, the top countries were Denmark, Luxembourg, Switzerland, the United Kingdom, France, Austria, Finland, Sweden, Norway, and Germany53. Russia ranked 58th.
What is not an indicator of a high standard of living
Conservatives of various persuasions often try to replace the aforementioned indices with indicators that do not demonstrate how good life is in a country. For example, they try to present population growth in a country as an indicator of the standard of living. A typical usage example: “under Stalin the population grew, which means the standard of living was high”. However, in the least prosperous regions of the world, the population is growing — for example, in 1995 the population of Africa was about 717 million people, and in 2020 it was already about 1,313 million54. At the same time, in one of the most developed regions — Europe — about 727 million people lived in 1995, and in 2020 only about 748 million55. Consequently, population growth in no way indicates a high standard of living.
The next indicator is GDP or GDP per capita. It can indeed tell us a lot about a country’s economic development and most often even about its level of prosperity. However, the point here is that it is often presented as an indicator that in itself speaks to a high standard of living and renders other indicators redundant, which is misleading. High production volumes do not yet mean that the funds raised from them will go toward improving the well-being of citizens. They can be spent unwisely or appropriated by narrow circles of individuals. For example, in 2020, according to World Bank data, Saudi Arabia ranked 26th among countries with the highest GDP per capita56, but only 71st in the Legatum Prosperity Index57 (out of 167). Russia ranks 55th and 76th, respectively. Meanwhile Finland, although rounding out the top five leading countries in the Prosperity Index, holds a relatively modest 24th place in GDP per capita. Renowned economists Joseph Stiglitz and Amartya Sen, in the report of the Commission on the Measurement of Economic Performance and Social Progress, emphasized the overestimation of GDP as a measure of standard of living:
GDP mainly measures market production, though it has often been treated as if it were a measure of economic well-being. Conflating the two can lead to misleading signals about how well-off people are and entail wrong policy decisions.
<…>
First, some goods and services may not have a price (for instance, if the government provides free health insurance, or if households raise children by themselves), which raises the question of how to value them. Second, even where there are market prices, these may deviate from society’s underlying valuation. In particular, when the consumption or production of individual products impacts the rest of society, the price people pay for these products will differ from their value to society as a whole. A well-known example is environmental degradation caused by individual production or consumption activities, which is not reflected in market prices58.
Conclusion
This article presents a modern system of indicators that captures the presumed standard of living in a country. Social democrats in their policies are guided not only by political philosophy and its values, but also monitor the results of their activities — through scientifically tested, permanently updated, and improved methods.
A high standard of living is one of the key social-democratic and progressive values, which is why it is extremely important for our movement to achieve high figures in these indices and rankings while simultaneously monitoring their level of transparency. In doing so, we will make the lives of citizens in our countries better and more comfortable. There are certain indices that are of primary importance and serve as the main measures of the standard of living — these are the HDI, GNI per capita, and the Prosperity Index. However, other indices should not be forgotten either, and one should work toward improving the country’s metrics wherever possible.
The author thanks Vladislav Sovko and Viktor Antonov for their assistance in writing the article.
- O.N. Gorbunova. Human Development Index: change of methodology // Socio-economic phenomena and processes. 2012. No. 11.
- The next frontier. Human development and the Anthropocene // United Nations Development Programme (hdr.undp.org). [Online resource]: http://hdr.undp.org/sites/default/files/hdr2020.pdf (Accessed: 08.11.2021).
- Ha-Joon Chang. Economics: The User’s Guide. – Penguin Books, 2014.
- GNI per capita, PPP (current international $) // The World Bank (www.worldbank.org). [Online resource]. URL: https://data.worldbank.org/indicator/NY.GNP.PCAP.PP.CD?most_recent_value_desc=true&year_high_desc=true (Accessed: 08.11.2021).
- WJP Rule of Law Index // World Justice Project (worldjusticeproject.org). [Online resource]. URL: https://worldjusticeproject.org/rule-of-law-index/ (Accessed: 08.11.2021).
- 2020 Global SPI Findings // The Social Progress Imperative (www.socialprogress.org). [Online resource]: https://www.socialprogress.org/static/8dace0a5624097333c2a57e29c2d7ad9/2020-global-spi-findings.pdf (Accessed: 08.11.2021).
- The Legatum Prosperity Index 2020 // Prosperity (www.prosperity.com). [Online resource]. URL: https://www.prosperity.com/rankings (Accessed: 08.11.2021).
- The Legatum Prosperity Index 2020. A tool for transformation // Prosperity (www.prosperity.com). [Online resource]. URL: https://docs.prosperity.com/2916/0568/0539/The_Legatum_Prosperity_Index_2020.pdf (Accessed: 08.11.2021).
- V.V. Radaev. Sociology of consumption: basic approaches // Sociological Studies. 2005. No. 1.
- Households and NPISHs Final consumption expenditure per capita (constant 2015 US $) // The World Bank (www.worldbank.org). [Online resource]. URL: https://data.worldbank.org/indicator/NE.CON.PRVT.PC.KD (Accessed: 08.11.2021).
- iPhone Index 2021: how many days do you need to work for the new release in different countries? // Picodi (www.picodi.com). September 15, 2021. [Online resource]. URL: https://www.picodi.com/ru/mozhno-deshevle/indeks-iphone-2021 (Accessed: 28.11.2021).
- Median Income By Country 2021 // World Population Review (worldpopulationreview.com). [Online resource]. URL: https://worldpopulationreview.com/country-rankings/median-income-by-country (Accessed: 08.11.2021).
- Rankings by Country of Average Monthly Net Salary (After Tax) (Salaries And Financing) // Numbeo (www.numbeo.com). [Online resource]. URL: https://www.numbeo.com/cost-of-living/country_price_rankings?itemId=105 (Accessed: 08.11.2021).
- Price Rankings by Country of Meal, Inexpensive Restaurant (Restaurants) // Numbeo (www.numbeo.com). [Online resource]. URL: https://www.numbeo.com/cost-of-living/country_price_rankings (Accessed: 08.11.2021).
- Glossary: At-risk-of-poverty rate // Statistics Explained (ec.europa.eu). [Online resource]: https://ec.europa.eu/eurostat/statistics-explained/index.php?title=Glossary:At-risk-of-poverty_rate (Accessed: 08.11.2021).
- At-risk-of-poverty rate increasing // SCB (www.scb.se). June 27, 2019, 9:30. [Online resource]. URL: https://www.scb.se/en/finding-statistics/statistics-by-subject-area/household-finances/income-and-income-distribution/income-and-tax-statistics/pong/statistical-news/income-and-tax-statistics-income-report-2017/ (Accessed: 08.11.2021).
- Ivan Tkachov. Rosstat assessed the number of poor for the first time based on the “poverty line” // RBC (www.rbc.ru). December 3, 2021, 19:19. [Online resource]. URL: https://www.rbc.ru/economics/03/12/2021/61aa34739a7947e24f034e11 (Accessed: 28.09.2023).
- 2021 Poverty Guidelines // Office of the Assistant Secretary for Planning and Evaluation (aspe.hhs.gov). [Online resource]. URL: https://aspe.hhs.gov/2021-poverty-guidelines (Accessed: 28.09.2023).
- Poverty threatens ever more people in Germany // Deutsche Welle (www.dw.com). August 13, 2020. [Online resource]. URL: https://www.dw.com/en/poverty-in-germany-on-the-rise/a-54553080 (Accessed: 28.09.2023).
- Ha-Joon Chang. Economics: The User’s Guide. – Penguin Books, 2014.
- Charlie Giattino, Esteban Ortiz-Ospina and Max Roser. Working Hours // Our World in Data (ourworldindata.org). [Online resource]. URL: https://ourworldindata.org/working-hours (Accessed: 08.11.2021).
- Ha-Joon Chang. Economics: The User’s Guide. – Penguin Books, 2014.
- Deaths due to work-related accidents per 100 000 // World Health Organization (gateway.euro.who.int). [Online resource]. URL: https://gateway.euro.who.int/en/indicators/hfa_456-4070-deaths-due-to-work-related-accidents-per-100-000/ (Accessed: 08.11.2021).
- Unemployment, total (% of total labor force) (modeled ILO estimate) // The World Bank (www.worldbank.org). June 15, 2021. [Online resource]. URL: https://data.worldbank.org/indicator/SL.UEM.TOTL.ZS (Accessed: 08.11.2021).
- Working Conditions // World Economic Forum (reports.weforum.org). [Online resource]. URL: http://reports.weforum.org/social-mobility-report-2020/social-mobility-rankings/#series=SMI.D.08 (Accessed: 08.11.2021).
- Ha-Joon Chang. Economics: The User’s Guide. – Penguin Books, 2014.
- Gini index (World Bank estimate) // The World Bank (www.worldbank.org). [Online resource]. URL: https://data.worldbank.org/indicator/SI.POV.GINI?view=map (Accessed: 08.11.2021).
- Xunzhang Pan, Hailin Wang, Ziwei Wang, Lu Lin, Qi Zhang, Xinzhu Zheng, Wenying Chen. Carbon Palma Ratio: A new indicator for measuring the distribution inequality of carbon emissions among individuals // ScienceDirect (www.sciencedirect.com). May 20, 2019. [Online resource]. URL: https://www.sciencedirect.com/science/article/abs/pii/S0959652619332883 (Accessed: 08.11.2021).
- Ha-Joon Chang. Economics: The User’s Guide. – Penguin Books, 2014.
- Social Mobility Index // World Economic Forum (reports.weforum.org). [Online resource]. URL: http://reports.weforum.org/social-mobility-report-2020/social-mobility-rankings/ (Accessed: 08.11.2021).
- Intentional homicides (per 100,000 people) // The World Bank (www.worldbank.org). [Online resource]. URL: https://data.worldbank.org/indicator/VC.IHR.PSRC.P5 (Accessed: 08.11.2021).
- Fragile States Index | The Fund for Peace // Fragile States Index (fragilestatesindex.org). [Online resource]. URL: https://fragilestatesindex.org/ (Accessed: 08.11.2021).
- Global Peace Index Global Peace Index 2021 // Vision Of Humanity (www.visionofhumanity.org). [Online resource]. URL: https://www.visionofhumanity.org/wp-content/uploads/2021/06/GPI-2021-web-1.pdf (Accessed: 08.11.2021).
- WEF GCI 2017-2018 Scorecard // World Economic Forum (reports.weforum.org). [Online resource]. URL: https://reports.weforum.org/pdf/gci-2017-2018-scorecard/WEF_GCI_2017_2018_Scorecard_EOSQ057.pdf (Accessed: 08.11.2021).
- Life expectancy and Healthy life expectancy // World Health Organization (www.who.int). [Online resource]. URL: https://apps.who.int/gho/data/node.main.688 (Accessed: 08.11.2021).
- Democracy Index 2020: In sickness and in health? // Economist Intelligence (www.eiu.com). [Online resource]. URL: https://www.eiu.com/n/campaigns/democracy-index-2020/ (Accessed: 08.11.2021).
- 2020 World Press Freedom Index // Reporters without borders (rsf.org). [Online resource]. URL: https://rsf.org/en/ranking (Accessed: 08.11.2021).
- Ian Vásquez and Fred McMahon. Human Freedom Index 2020 // Cato Institute (www.cato.org). [Online resource]. URL: https://www.cato.org/human-freedom-index/2020 (Accessed: 08.11.2021).
- Country Rankings // Index of Economic Freedom (www.heritage.org). [Online resource]. URL: https://www.heritage.org/index/ranking (Accessed: 08.11.2021).
- Global Slavery Index // Walk Free (www.walkfree.org). [Online resource]. URL: https://www.walkfree.org/global-slavery-index/ (Accessed: 28.09.2023).
- The Social Mobility Report 2020: Health // World Economic Forum (reports.weforum.org). [Online resource]. URL: http://reports.weforum.org/social-mobility-report-2020/social-mobility-rankings/#series=SMI.A.01 (Accessed: 08.11.2021).
- The Social Mobility Report 2020: Education Quality and Equity // World Economic Forum (reports.weforum.org). [Online resource]. URL: http://reports.weforum.org/social-mobility-report-2020/social-mobility-rankings/#series=SMI.B.03 (Accessed: 08.11.2021).
- Ibid.
- The Social Mobility Report 2020: Inclusive Institutions // World Economic Forum (reports.weforum.org). [Online resource]. URL: http://reports.weforum.org/social-mobility-report-2020/social-mobility-rankings/#series=SMI.E.10 (Accessed: 08.11.2021).
- The Global Social Mobility Report 2020 Equality, Opportunity and a New Economic Imperative // World Economic Forum (www.weforum.org). [Online resource]. URL: https://www3.weforum.org/docs/Global_Social_Mobility_Report.pdf (Accessed: 08.11.2021).
- Ross Williams, Anne Leahy. U21 Ranking of National Higher Education Systems 2020 // Universitas 21 (universitas21.com). [Online resource]. URL: https://universitas21.com/sites/default/files/2020-04/U21_Rankings%20Report_0320_Final_LR%20Single.pdf (Accessed: 08.11.2021).
- Ha-Joon Chang. Economics: The User’s Guide. – Penguin Books, 2014.
- Better Life Index // OECD (www.oecd.org). [Online resource]. URL: https://stats.oecd.org/Index.aspx?DataSetCode=BLI (Accessed: 08.11.2021).
- John F. Helliwell, Richard Layard, Jeffrey D. Sachs, and Jan-Emmanuel De Neve. World Happiness Report 2020 // World Happiness Report (worldhappiness.report). [Online resource]. URL: https://happiness-report.s3.amazonaws.com/2020/WHR20.pdf (Accessed: 08.11.2021).
- John F. Helliwell, Richard Layard, Jeffrey D. Sachs, Jan-Emmanuel De Neve, Lara B. Aknin, and Shun Wang. World Happiness Report 2021 // World Happiness Report (worldhappiness.report). [Online resource]. URL: https://happiness-report.s3.amazonaws.com/2021/WHR+21.pdf (Accessed: 08.11.2021).
- Ha-Joon Chang. Economics: The User’s Guide. – Penguin Books, 2014.
- Quality of Life Index by Country 2021 Mid-Year // Numbeo (www.numbeo.com). [Online resource]. URL: https://www.numbeo.com/quality-of-life/rankings_by_country.jsp (Accessed: 08.11.2021).
- Environmental Performance Index Results Overview // Environmental Performance Index (epi.yale.edu). [Online resource]. URL: https://epi.yale.edu/epi-results/2020/component/epi (Accessed: 08.11.2021).
- Africa Population 1950-2021 // Macrotrends (www.macrotrends.net). [Online resource]. URL: https://www.macrotrends.net/countries/AFR/africa/population (Accessed: 08.11.2021).
- D. Clark. Estimated population of Europe from 1950 to 2021 // Statista (www.statista.com). July 27, 2021. [Online resource]. URL: https://www.statista.com/statistics/1106711/population-of-europe/ (Accessed: 08.11.2021).
- GDP per capita, PPP (current international $) // The World Bank (www.worldbank.org). [Online resource]. URL: https://data.worldbank.org/indicator/NY.GDP.PCAP.PP.CD?end=2020&most_recent_value_desc=true&start=2020&view=bar (Accessed: 08.11.2021).
- The Legatum Prosperity Index 2020 // Prosperity (www.prosperity.com). [Online resource]. URL: https://www.prosperity.com/rankings (Accessed: 08.11.2021).
- Joseph E. Stiglitz, Amartya Sen, Jean-Paul Fitoussi. Mismeasuring Our Lives: Why GDP Doesn’t Add Up. – The New Press, 2010.